Crypto Updates: Key Movements in Bitcoin, Ethereum, and Toncoin Market Trends & Analysis from the Previous Week
In Brief
In this write-up, we're diving into the weekly performance of three major cryptocurrencies: Bitcoin, Ethereum, and Toncoin.
Bitcoin News & Macro
Last week was quite eventful for Bitcoin, with some significant actions shaking up the market. It all began when the German government offloaded 900 Bitcoins, which nudged the price downward. Then, the notorious Mt. Gox re-emerged, revealing a strategy to reimburse former creditors in Bitcoin, sending ripples of anxiety through the investor community.
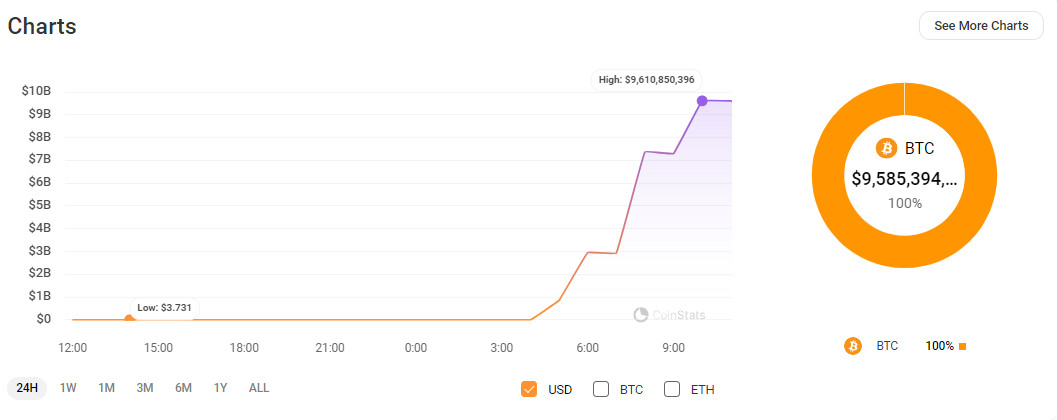
Holdings of the Mt. Gox wallet '1Jbez' Source: CoinStats
Market observers were on edge as the price dropped in reaction, showcasing how sensitive investors are to the potential influx of coins. However, some experts argue that this turmoil may not be as catastrophic as it seems. For instance, Tony Sycamore, an analyst at IG Markets, comforts us by suggesting that we’ve been aware of these payouts for quite some time, so it shouldn't catch anyone off guard.

Source: CoinShares
According to CoinShares’ 'Digital Asset Fund Flows Weekly' report, there was a substantial withdrawal of $584 million from Bitcoin investment vehicles. It seems investors are seeking refuge elsewhere amidst the turmoil of rising interest rates and broader economic challenges. These withdrawals are particularly notable in areas that are experiencing financial difficulties.
Despite these challenges, Bitcoin has managed to maintain its position above $60,000. However, it remains precarious, highly susceptible to any shift in market sentiment. As we monitor these developments, anticipate further fluctuations and keep your attention sharp.
BTC Price Analysis
Throughout the last week, Bitcoin's price movements have stayed within a certain range, characterized by sudden surges and swift declines.
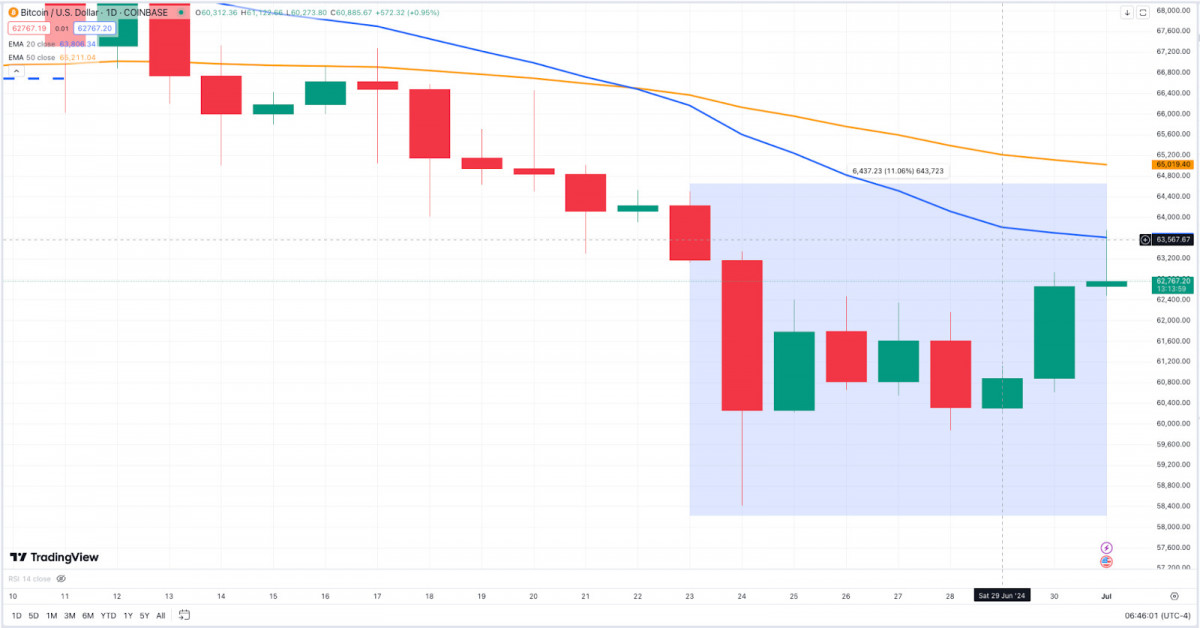
BTCUSD 1D Chart, Coinbase. Source: TradingView
On the daily chart, Bitcoin experienced a downturn, breaking through the support level at $64,000 and dipping to around $60,000. This movement is part of a broader bearish trend affected by macroeconomic concerns and negative market psychology. The downward slope of both the 20-day EMA (blue line) and the 50-day EMA (orange line) underscores this prevailing bearish sentiment observed over recent weeks.
Nonetheless, Bitcoin quickly found its footing again, stabilizing around the $60,000 mark. Buyers came in to uphold this critical support level, prompting a series of upward movements — signaling a potential resurgence in buying activity.
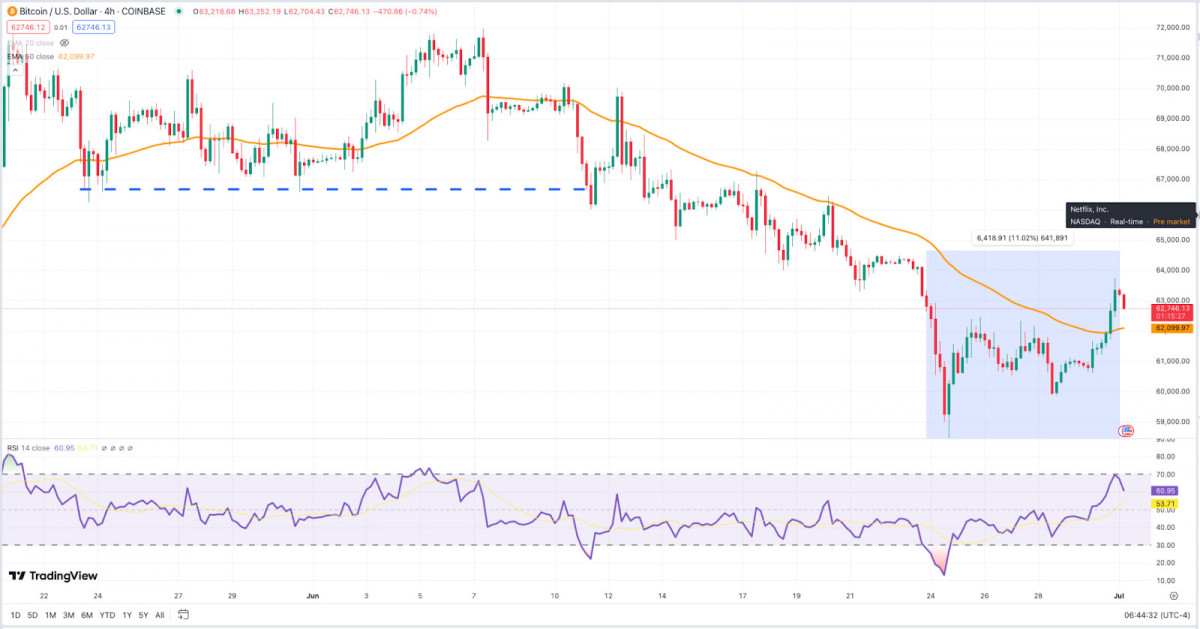
BTCUSD 4H Chart, Coinbase. Source: TradingView
Looking closer at the 4-hour chart reveals some interesting trends. Following the support breach, Bitcoin rebounded and surged toward the $63,000 resistance, a recovery signal mirrored by a rising RSI, which moved out of oversold conditions, indicating the possibility of a brief bullish turnaround. That said, the $63,000 resistance proved formidable, leading Bitcoin into a period of consolidation around that range.
Daily closes above the $60,000 level have afforded bulls a psychological advantage, reinforcing this support. Meanwhile, the $63,000 resistance has turned into a battlefield, with sellers eager to limit any upward momentum.
Market participants appear to be positioning themselves, preparing for the next significant shift.
Ethereum News & Macro
Ethereum's market also experienced notable movements this week. The SEC discontinued its investigation into Ether, categorizing it as a commodity rather than a security. This shift provided a quick boost in investor confidence, although skepticism still lingers for some.
Analysts remain cautious, cautioning that the anticipated approval for a spot ETH ETF may not fuel the rally that traders are hoping for. Premium metrics from the futures markets provided by Laevitas.ch indicate that reaching $3,700 might be overly optimistic, casting a shadow over potential immediate gains.
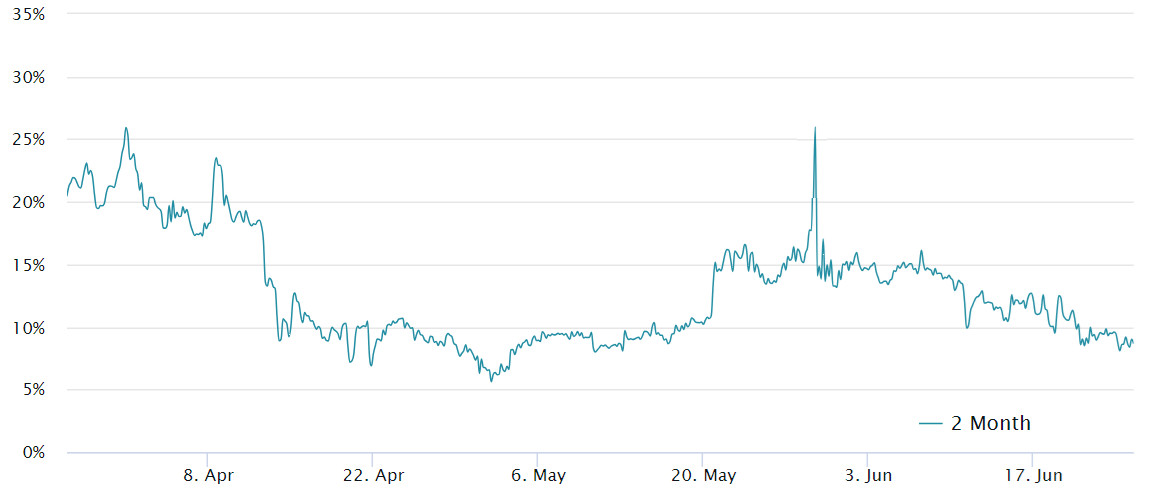
A drop in the premium of 2-month ETH futures, Source: Laevitas.ch
Compounding concerns, Andrew Kang of Mechanism Capital issued a serious warning: without a robust economic framework, Ethereum could face a 30% decline following the ETF launch.
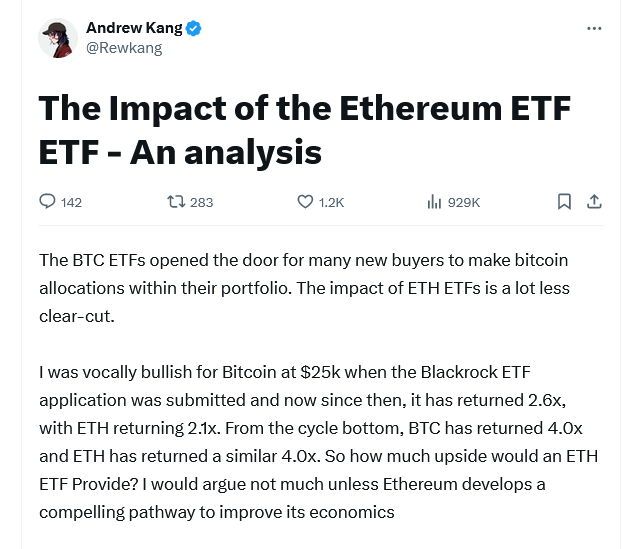
Andrew Kang’s (@rewkang) Tweet on the grim prospect of ETH Spot ETF approval
Kang contended that Ethereum has already tapped its peak gains, and any further increases will require significant enhancements to the ecosystem's economic model.
Additionally, Ethereum's transaction fees (alongside Bitcoin's) have plummeted to a seven-month low. While reduced fees can draw users in, they also suggest diminished market activity.
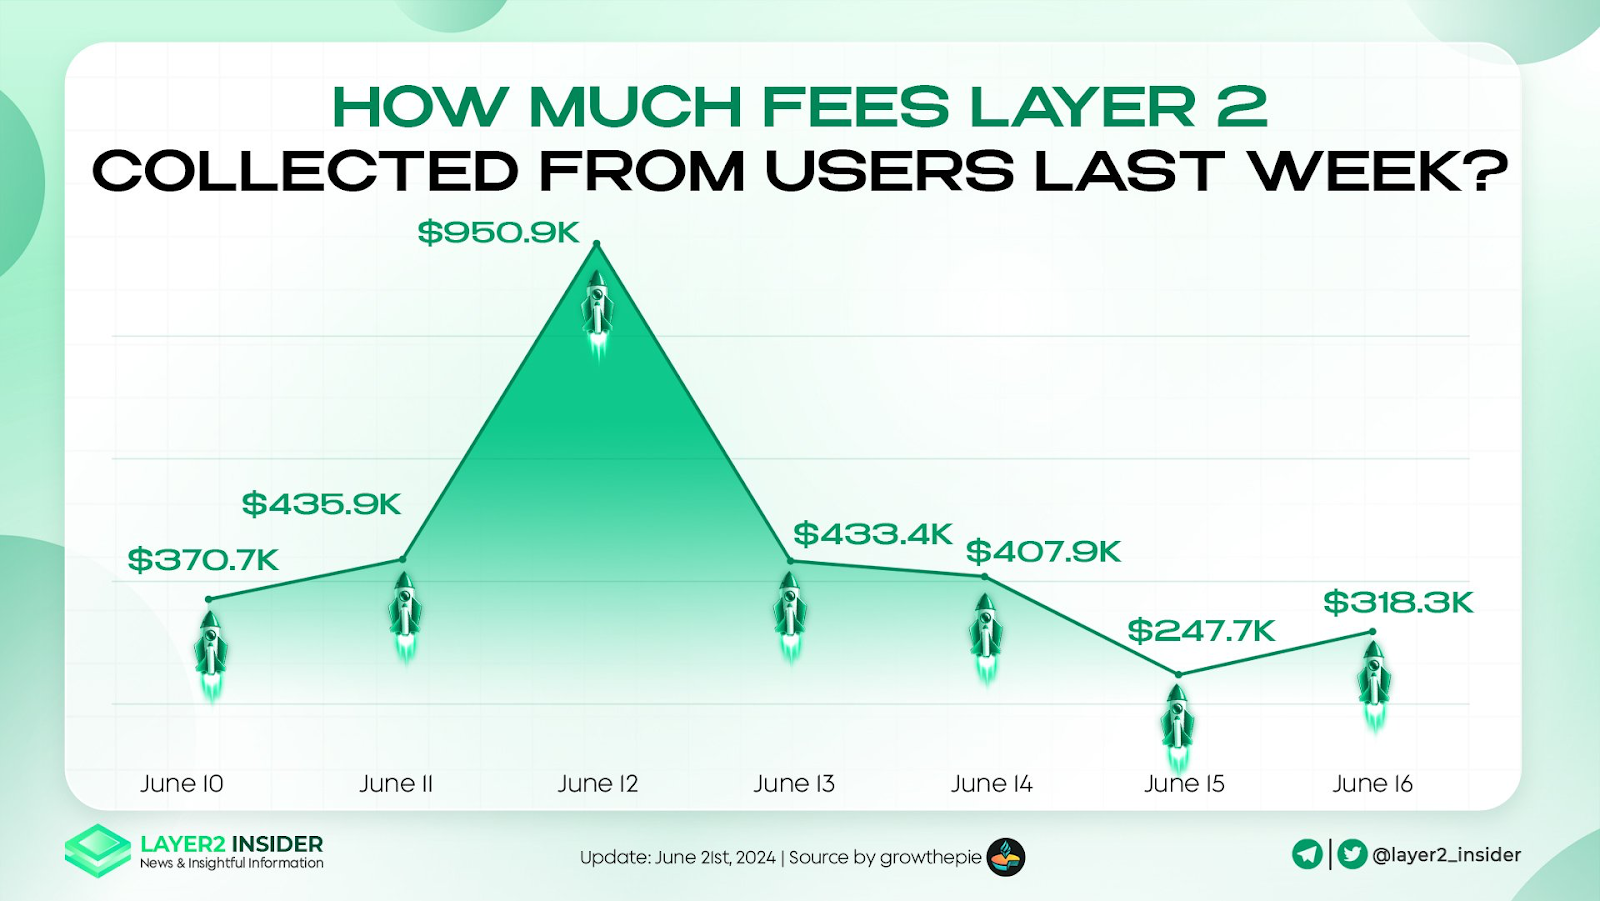
A decline in Ethereum fees report by Layer2Insider
On a brighter note, Ethereum's ecosystem is thriving with creative advancements. New decentralized networks and options for asset restaking continue to emerge, presenting potential growth opportunities despite existing risks and uncertainties.
ETH Price Analysis
Ethereum’s price dynamics over the past week, illustrated within the blue box, have been characterized by consolidation with slight rebounds.
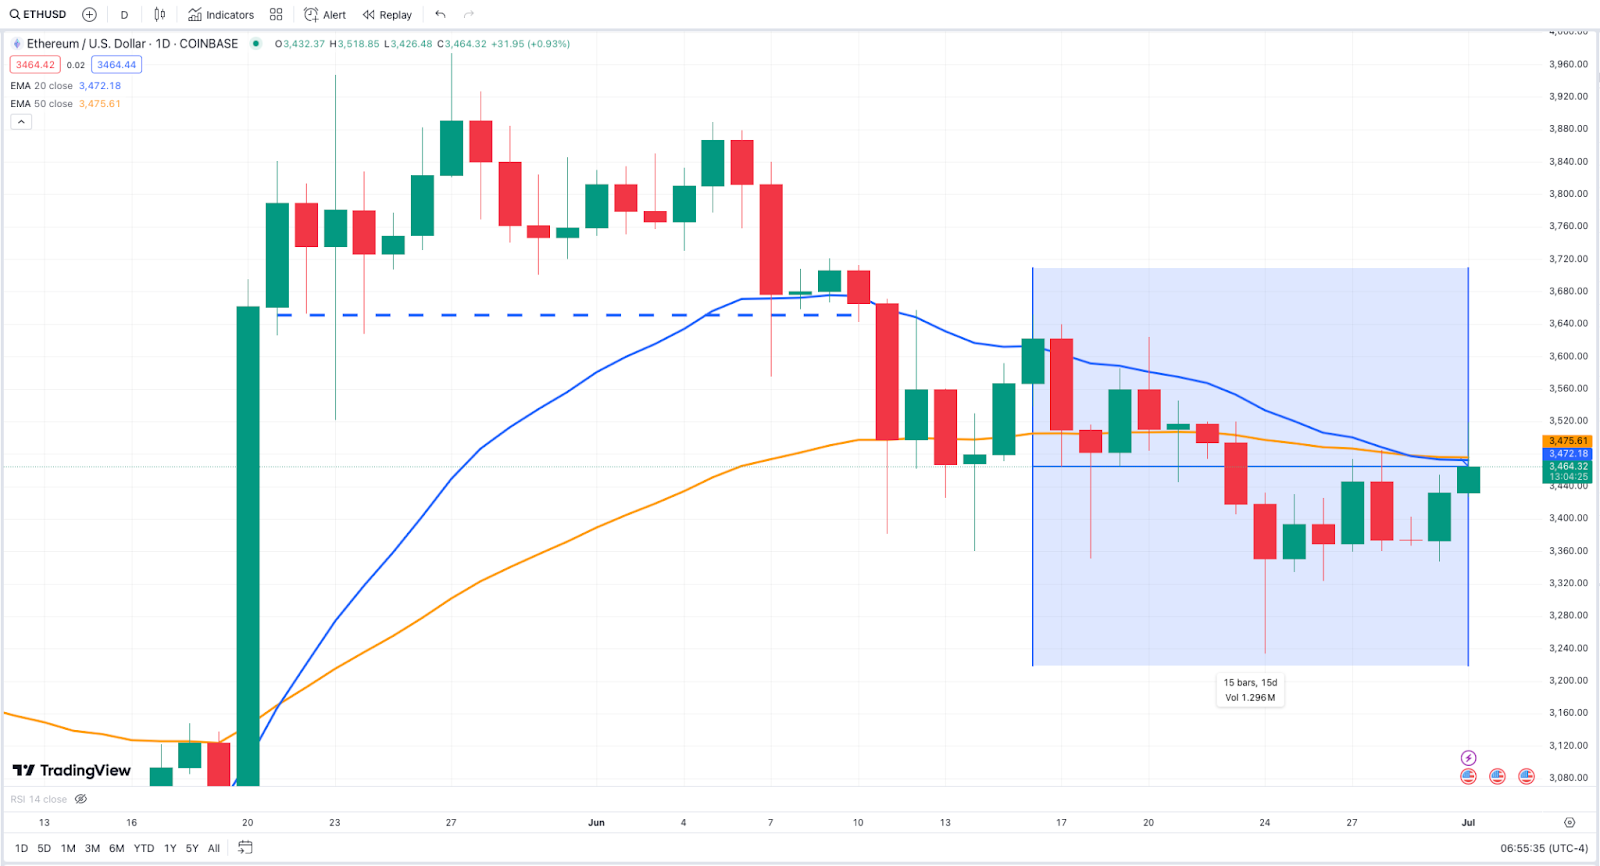
ETHUSD 1D Chart, Coinbase. Source: TradingView
On the daily chart, Ethereum has struggled to establish a clear trend. Following several selloffs, the price found support near the $3,400 mark, where buyers stepped in to halt further drops. This support level has been crucial in recent weeks, acting as a bounce-back point. The 20-day EMA (blue line) and the 50-day EMA (orange line) remain nearly parallel, hinting at a phase of consolidation rather than a definitive trend in either direction.
The activity over the past week saw Ethereum attempting to break above the $3,500 resistance but failing to stay above it. This level has consistently acted as a cap, causing the price to retract each time it gets near it.
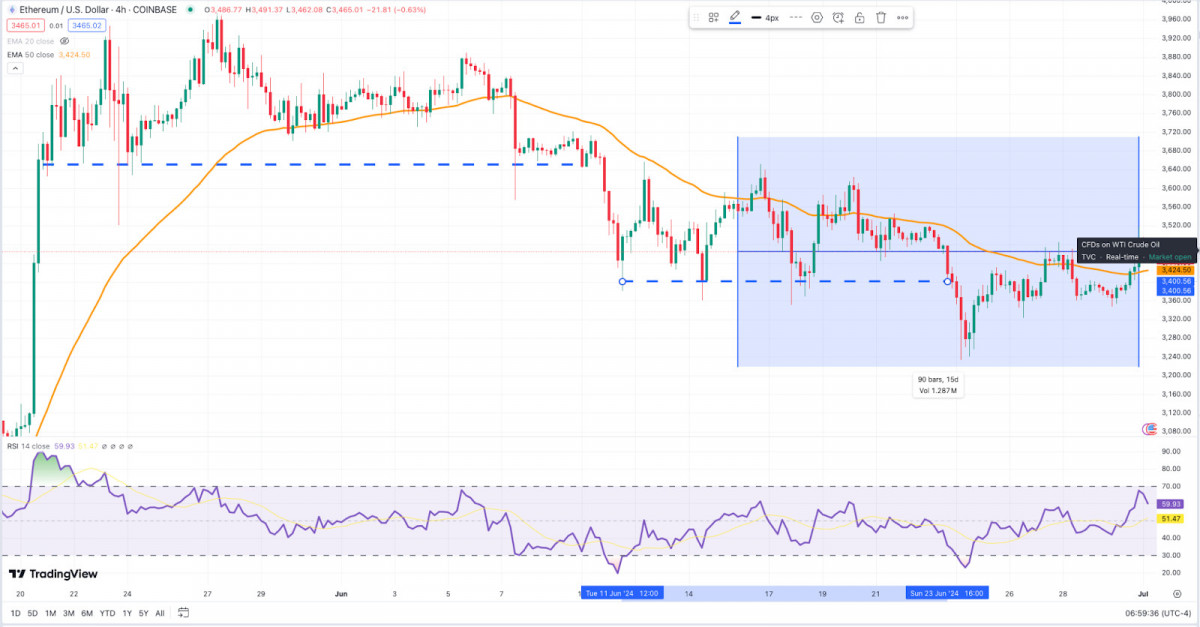
ETHUSD 4H Chart, Coinbase. Source: TradingView
On the 4-hour chart, ETH tested the support around $3,320 before rallying to the $3,500 resistance. This rally was accompanied by an increase in the RSI, which moved out of the oversold zone, signifying heightened buying interest. However, the resistance around $3,500 remained intact, leading to another phase of consolidation. The 50-EMA on the 4-hour chart has served as an active resistance, curving downwards and reflecting the overall bearish sentiment in the shorter timeframe.
Toncoin News & Macro
Toncoin has once again attracted attention from regulators this past week, despite the market's inherent volatility. The primary catalyst was Kazakhstan’s endorsement for trading on licensed crypto exchanges, a significant endorsement for Toncoin’s legitimacy and trading potential.
The TON Foundation made headlines by transferring 30 million TON (approximately $230 million) to Telegram. This substantial support is likely to lend significant momentum to Toncoin’s price.
However, the ecosystem also faced challenges due to phishing attacks, with analyst SlowMist highlighting weaknesses in Telegram’s infrastructure, which has left short-term traders feeling apprehensive.
On a more positive note, Telegram initiated a $20 million fund to bolster the TON ecosystem, aiming to enhance development and adoption, further embedding Toncoin within the crypto universe.
TON Price Analysis
Toncoin’s (TON) price behavior over the last week demonstrates a phase of consolidation with minor fluctuations around recent key levels. Similar to BTC and ETH, there's been a tug-of-war between bulls and bears, with no clear victor yet emerging.
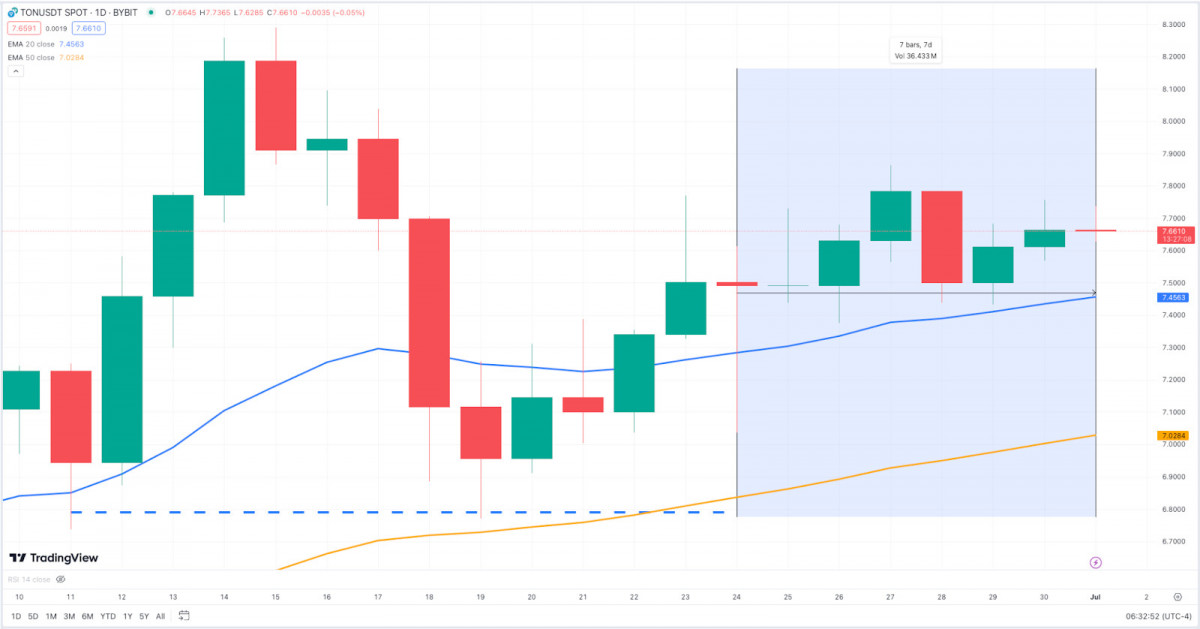
TONUSDT 1D Chart, ByBit. Source: TradingView
On the daily chart, TON has been fluctuating between a support level of $7.45 and resistance at $7.70. The 20-day EMA (blue line) positioned just above the current price suggests a slight bearish sentiment, while the positively inclined 50-day EMA (orange line) hints at potential long-term bullish prospects. This convergence of EMAs indicates a phase of indecision within the market, where neither side seems to assert dominance.
Within this range, several smaller rallies and corrections have unfolded. Attempts to突破 the $7.70 resistance have faced selling pressure, leading to price declines. Conversely, the $7.45 support has remained robust, attracting buyers and sustaining the ongoing consolidation.
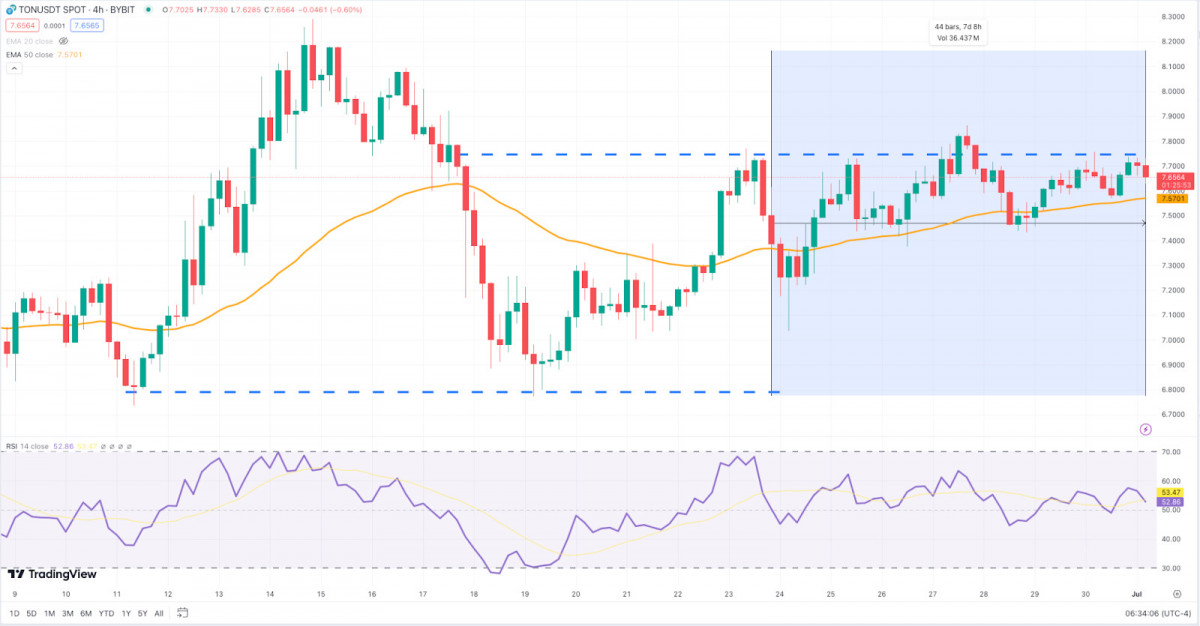
BTCUSD 4H Chart, ByBit. Source: TradingView
On the 4-hour chart, TON tested the $7.45 support and then momentarily rallied toward the $7.70 resistance. This surge saw the RSI rise from an oversold state to neutral, indicating a possible shift in short-term momentum. Yet, the persistent resistance around $7.70 resulted in a sideways movement around $7.65.
As always, traders need to stay alert and safeguard their investments.
Disclaimer
In line with the Trust Project guidelines Please be aware that the information provided on this page is not intended to constitute legal, tax, investment, financial, or any other form of advice. It’s crucial to invest only what you can afford to lose and to seek independent financial guidance if you have any uncertainties. For more information, we recommend reviewing the terms and conditions as well as the support and help pages from the issuer or advertiser. MetaversePost is dedicated to delivering accurate and unbiased reporting, but market conditions may change unpredictably.