Weekly Market Overview: Crypto Inflows, Whale Movements, and Price Fluctuations
In Brief
This week, the cryptocurrency market was bustling with activity. Bitcoin, Ethereum, and TON all experienced notable price increases, spurred by growing institutional interest surrounding ETF developments and incoming investments. However, this excitement was tempered by some market volatility, particularly due to factors like the German government's sales of Bitcoin and the impending repayments from Mt. Gox.
Bitcoin News & Macro
Bitcoin experienced a whirlwind of activity this week, with sharp fluctuations in both price and sentiment keeping traders on their toes. The German government contributed to the uncertainty by offloading 3,000 BTC in just 60 minutes, raising concerns about potential future sell-offs, especially as Germany plans to liquidate an additional $276 million in Bitcoin.
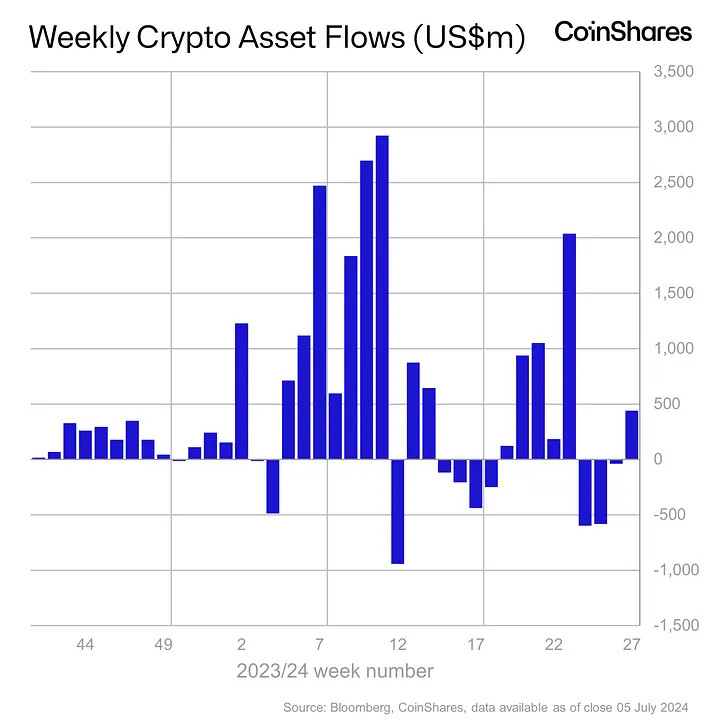
Source: CoinShares
Interestingly, this market pressure led to an influx of $441 million in digital assets, as investors took the opportunity to buy during the decline.

Source: F2Pool
Mining difficulty reached its lowest point since March, offering some respite to miners. Meanwhile, Metaplanet's acquisition of $2.5 million in Bitcoin illustrated sustained interest from corporate entities.
On top of the already heightened volatility, Mt. Gox's repayments began, injecting fresh uncertainty into the market. Germany's ongoing Bitcoin sell-off continued to apply downward pressure on prices, despite the robust buying activity from institutional investors, as evidenced by significant inflows into Bitcoin ETFs.
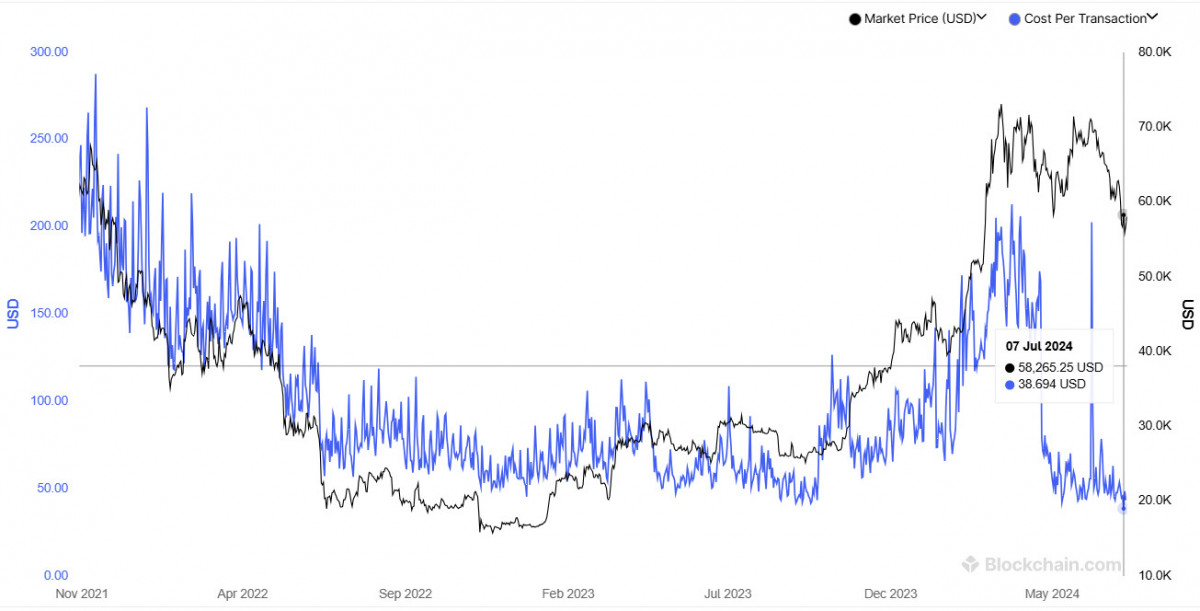
Source: Blockchain.com
Transaction fees dropped to levels not seen since 2020, indicating potential challenges within the network, while trader profit margins reflected the struggles of the 2022 bear market. Nevertheless, Bitcoin whales seized the opportunity to accumulate more BTC amidst the downturn.
In a surprising turn of events, Bitcoin's price skyrocketed to $62K, prompting analysts to suggest that the worst might be behind us. While there's a renewed sense of hope, the market remains highly volatile, leaving investors cautiously optimistic about its future trajectory. Despite recent bearish trends, some experts speculate that Bitcoin might have hit its bottom at $53K, but the strong resistance levels at $58,500 and $60,000 are still significant hurdles.
BTC Price Analysis
Looking at the daily chart, Bitcoin experienced a robust rally starting around July 10th, climbing from approximately $54,000 to about $63,000 by July 15th, marking an impressive 23% increase. The $54,000 level proved to be a strong support anchor, halting the decline in price.
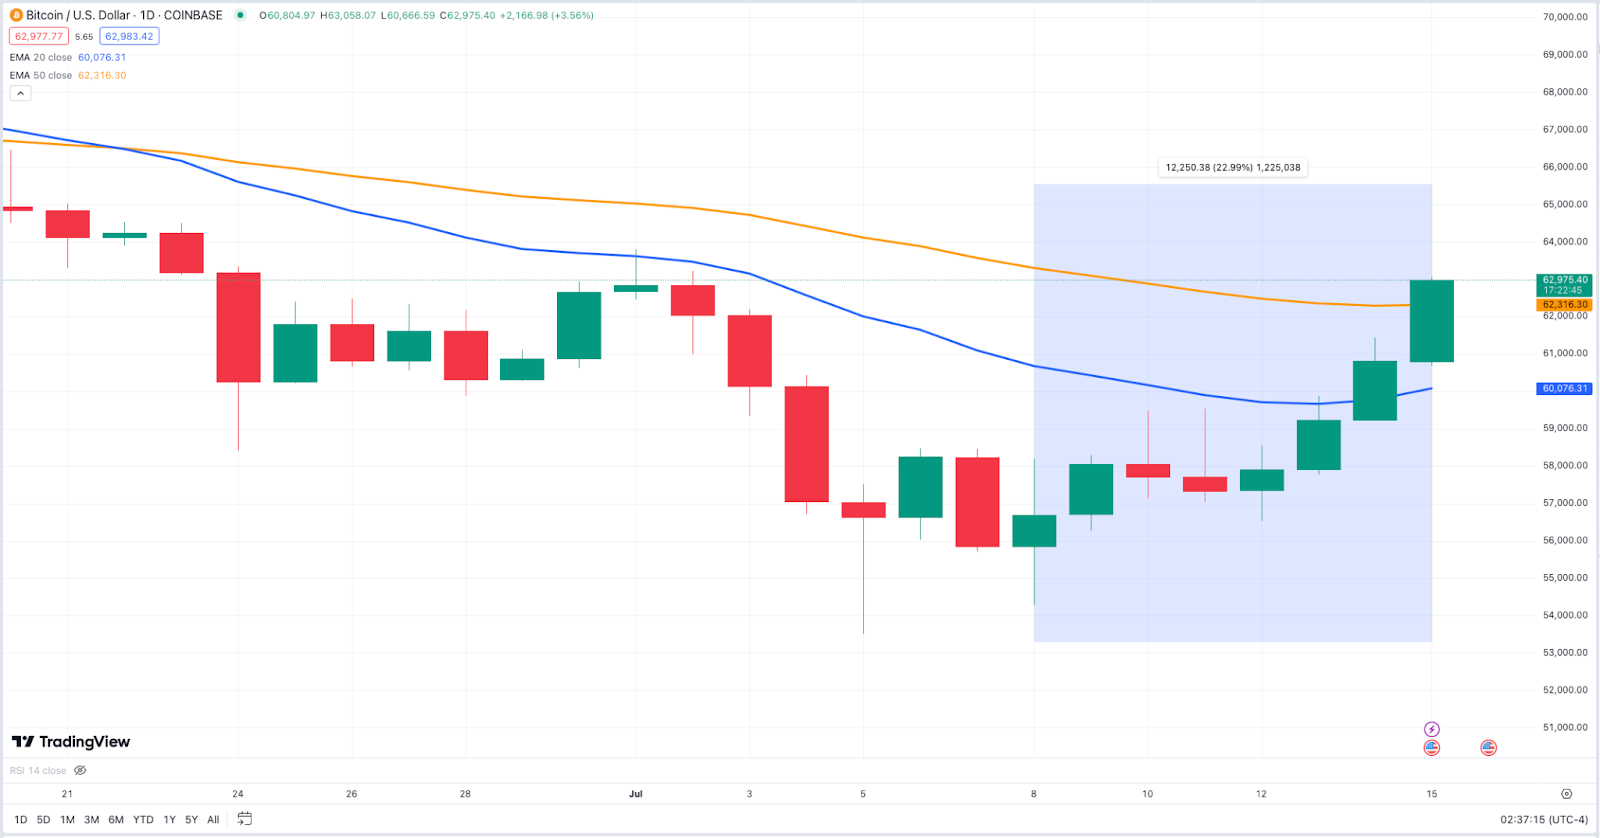
Source: TradingView
The rally managed to break through multiple resistance points, with $60,000 being a particularly challenging barrier. Following the breach, $60,000 became a new support level. Historically, surpassing this threshold indicates a shift in market sentiment, setting $65,000 as the next goal. Should the 20-EMA and 50-EMA converge, it may signal a golden cross, which would be another favorable indicator.
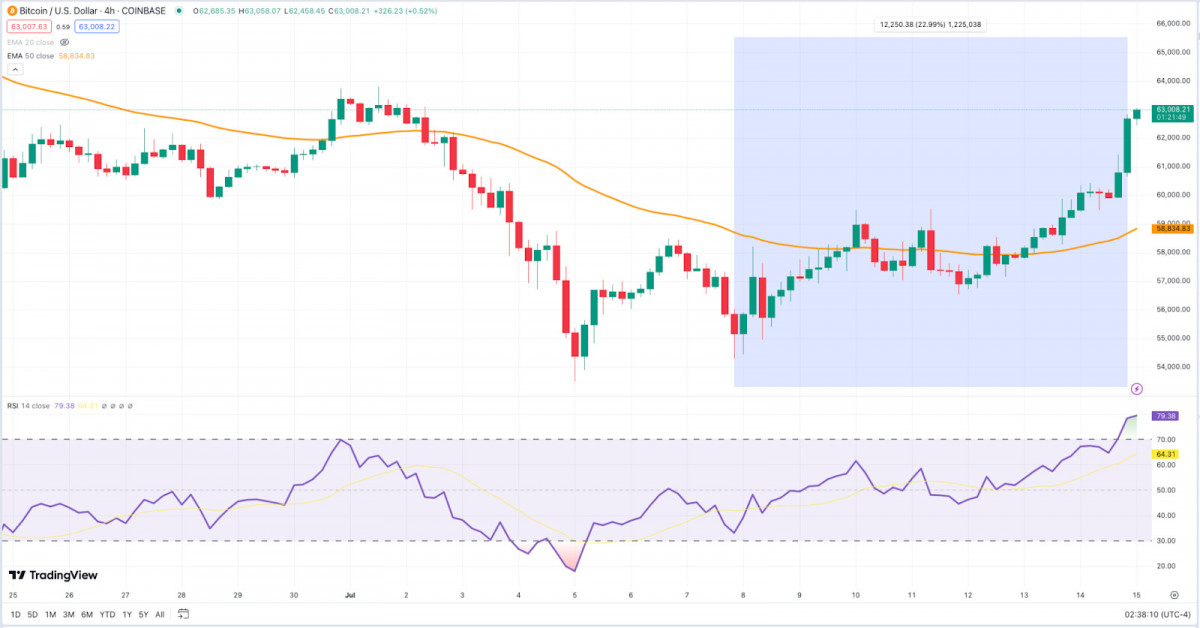
Source: TradingView
On the 4-hour chart, after hitting the $54,000 mark, Bitcoin shifted into an accumulation stage. Once it exceeded the 50-EMA, bullish momentum kicked in, confirmed by the RSI moving into overbought territory at 79.38.
Closing the week strongly above $60,000 suggests consistent bullish enthusiasm, while daily closes above this mark indicate readiness for further price increases. Key milestones to monitor are $60,000 as support and $65,000 as the upcoming major resistance. If bullish momentum continues, and prices stay above critical moving averages, Bitcoin may test and potentially surpass its previous highs.
Ethereum News & Macro
Excitement within the Ethereum community is palpable, fueled by Invesco’s Ether ETF which is generating competitive fee structures and attracting institutional interest, aligning with the recent buzz surrounding Bitcoin's ETF approvals.
MetaMask has rolled out a new set of tools for Web3, while Ethereum is hosting a $2 million 'Attackathon' aimed at enhancing security. Discussions of a price rally beyond $3,400 are gaining momentum, reflecting bullish indicators akin to Bitcoin's battles with essential price points.

Source: @spotonchain
Ethereum whale transactions amounting to $50 million ahead of ETF approvals showcased a strong sense of investor confidence, similar to the behavior of Bitcoin whales capitalizing on price dips. Despite setbacks, such as the failed heist involving the Inferno Drainer, Ethereum's growth trajectory remains robust.
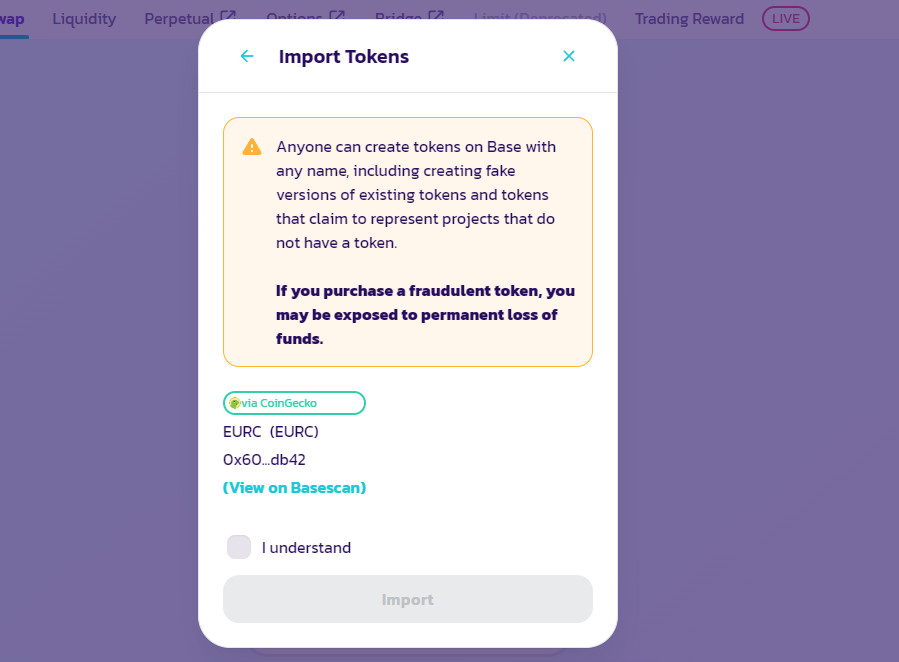
Source: PancakeSwap
The introduction of Circle’s euro-backed stablecoin, EURC, on Base and Starknet’s staking initiation have further bolstered Ethereum’s influence. Analysts speculate that ETF approvals could lead to $10 billion in ETH inflows, setting the stage for possible new price elevations, mirroring Bitcoin’s ETF-driven optimism.
ETH Price Analysis
Now, let's delve into the price actions, starting with the daily chart. Ethereum initiated a noteworthy rally around July 10th, rebounding from the $2,800 support level. By July 15th, ETH surged to approximately $3,350, reflecting Bitcoin’s remarkable performance.
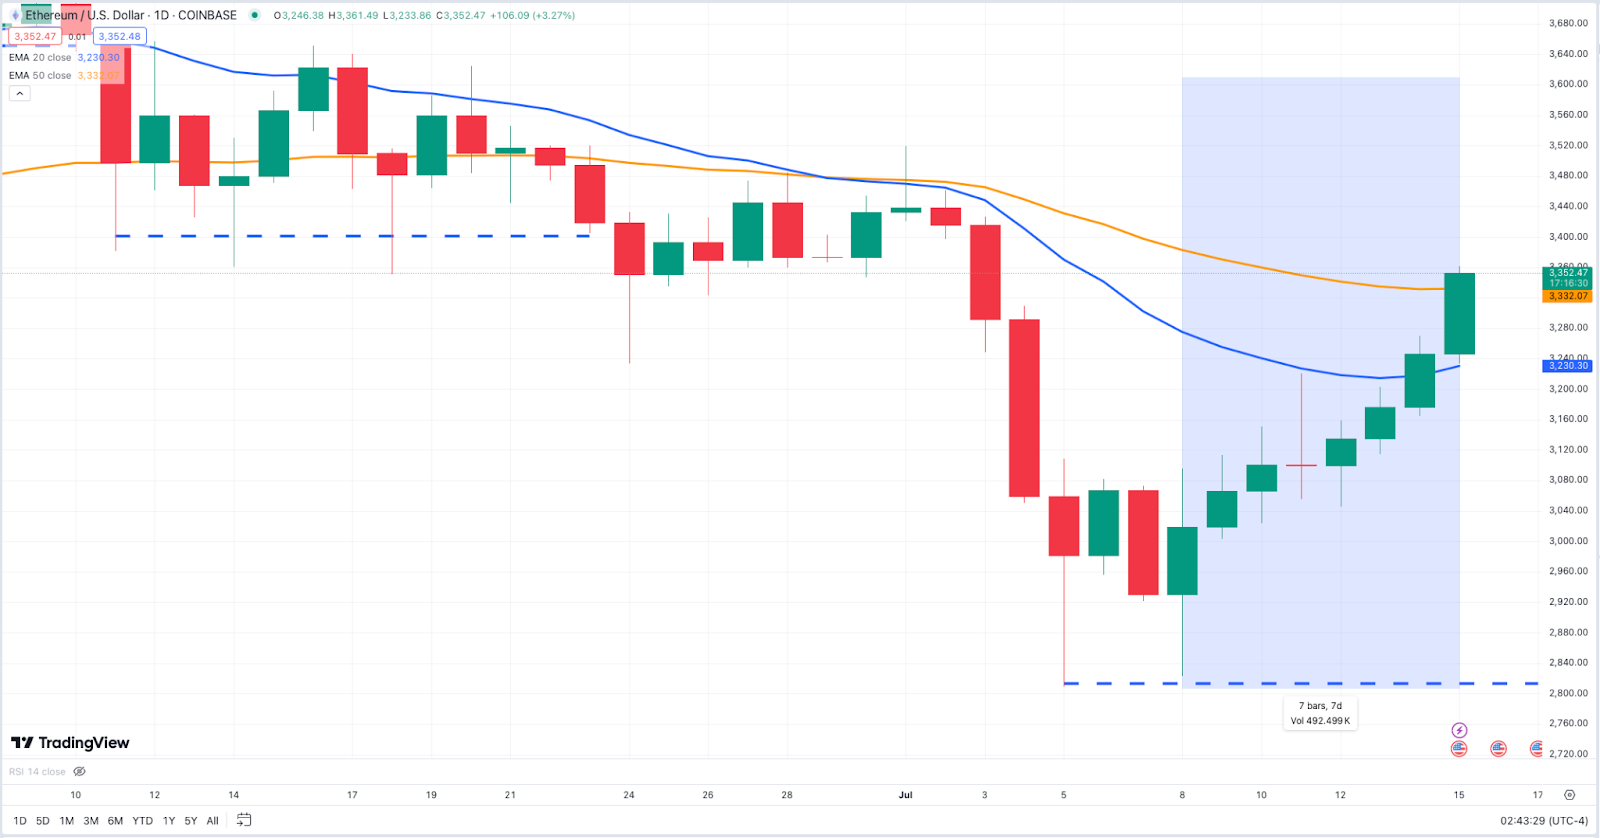
Source: TradingView
The $2,800 line proved to be a steadfast support, preventing any downturn and establishing a platform for the subsequent rally. As ETH climbed, it broke through several resistance barriers, particularly around $3,150. This breakout transformed past resistance into fresh support—an encouraging bullish indicator. Now, with $3,150 as a solid foundation, the potential for future gains seems promising. Historically, crossing above this mark tends to shift market sentiment, in a similar fashion to Bitcoin’s leap over $60,000. The merging of the 20-EMA and 50-EMA could also suggest a golden cross, akin to trends we've observed in Bitcoin.
Source: TradingView
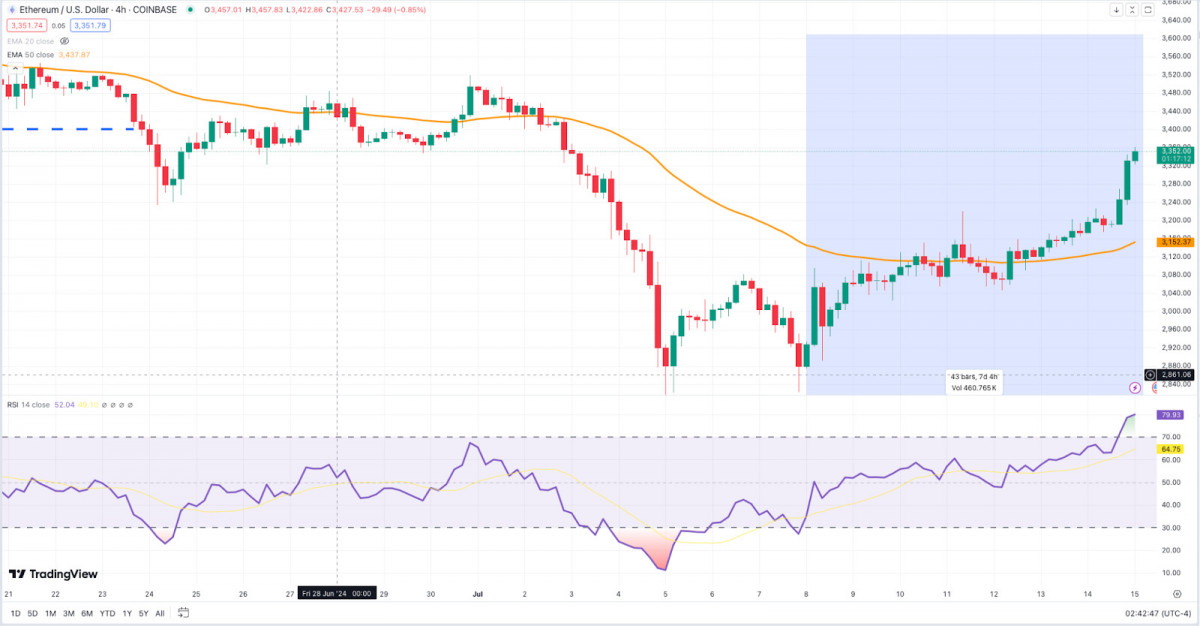
Examining the 4-hour chart, the price actions closely follow Bitcoin's patterns. After hitting the $2,800 threshold, ETH entered an accumulation phase, but once it broke above the 50-EMA on the 4-hour chart, the momentum sharply turned bullish. The RSI surged into the overbought range at 79.93, indicating significant buying pressure.
A robust weekly close above $3,150 reflects steady bullish sentiment, while daily closes above this mark suggest that the market is poised for higher prices. These levels align closely with Bitcoin’s overall bullish trend, enhancing the market's sentiment.
Traders should keep an eye on $3,150 as a support level and $3,400 as the next significant resistance. If the bullish momentum continues and prices maintain above key moving averages, Ethereum could test and potentially break previous highs.
Toncoin News & Macro
Now, let’s shift our focus to Toncoin. On July 9, the Ton Application Chain partnered with Polygon for a new layer-2 integration, which is expected to inundate the TON ecosystem with fresh applications, including DeFi and GameFi. Who could resist more hamsters, right?
Source: Unknown
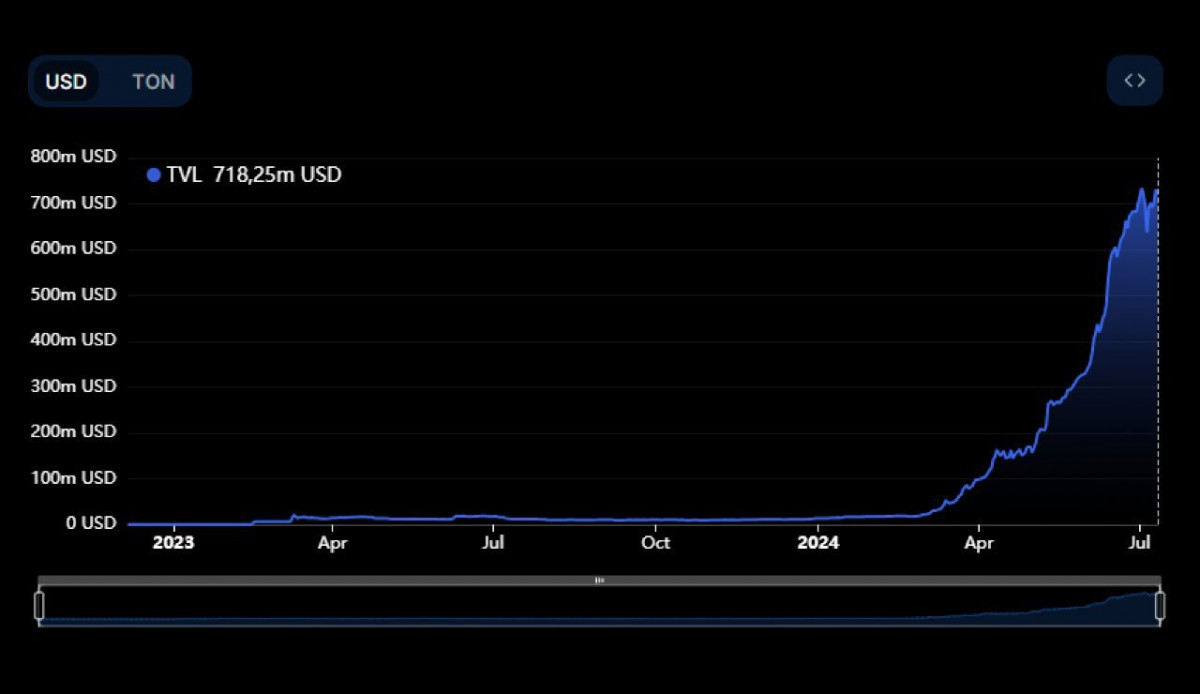
The total value locked (TVL) in TON surged past $700 million, a staggering increase from just $13 million at the year's onset—this clearly signals a growing institutional interest.
Adding to the excitement, 1inch and the TON Foundation launched a startup accelerator designed to enhance user experiences within the TON network, focusing on bridging projects between Web2 and Web3.

Source: @ByBit_Official
In market news, Bybit showcased TON's increasing popularity by listing Hamster Kombat in its premarket offering.
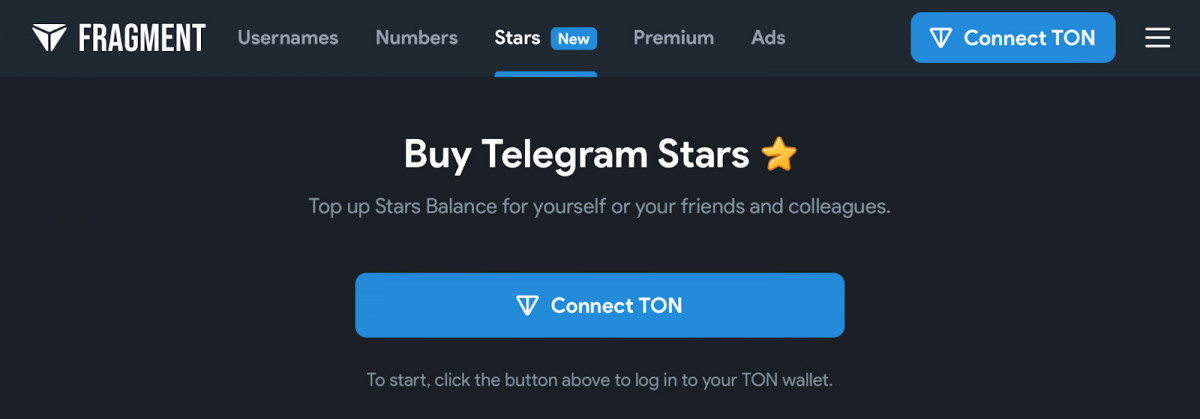
Source: Fragment
Additionally, the rollout of Telegram Stars, purchasable with TON, emphasized the coin's expanding influence in digital transactions. Could Ethereum's new euro-backed stablecoin have viable competition now? Only time will reveal the answers.
Now, let’s examine the TON price chart.
TON Price Analysis
In line with the positive sentiment reflected in Bitcoin and Ethereum, Toncoin’s price had an exhilarating week. On the daily chart, TON gained momentum around July 6th, rebounding from support at $6.30 and climbing to approximately $7.50 by July 15th.
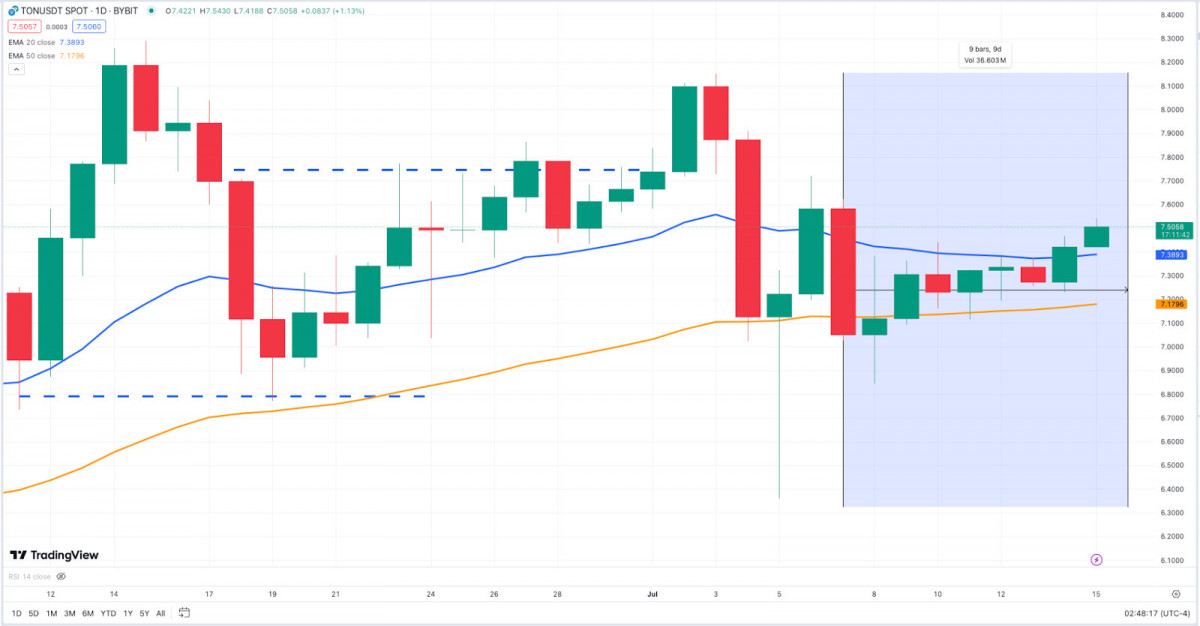
Source: TradingView
The $6.30 level proved resilient, halting the descending trend. As TON surged, it broke through the $7.15 resistance, converting it into new support. With $7.15 as a base, TON appears positioned for further gains. The token rose above the 20-EMA and is currently hovering around the 50-EMA at $7.18. A close above this would signal strong bullish momentum. If the 20-EMA crosses the 50-EMA, we could witness a golden cross similar to those seen in Bitcoin and Ethereum.
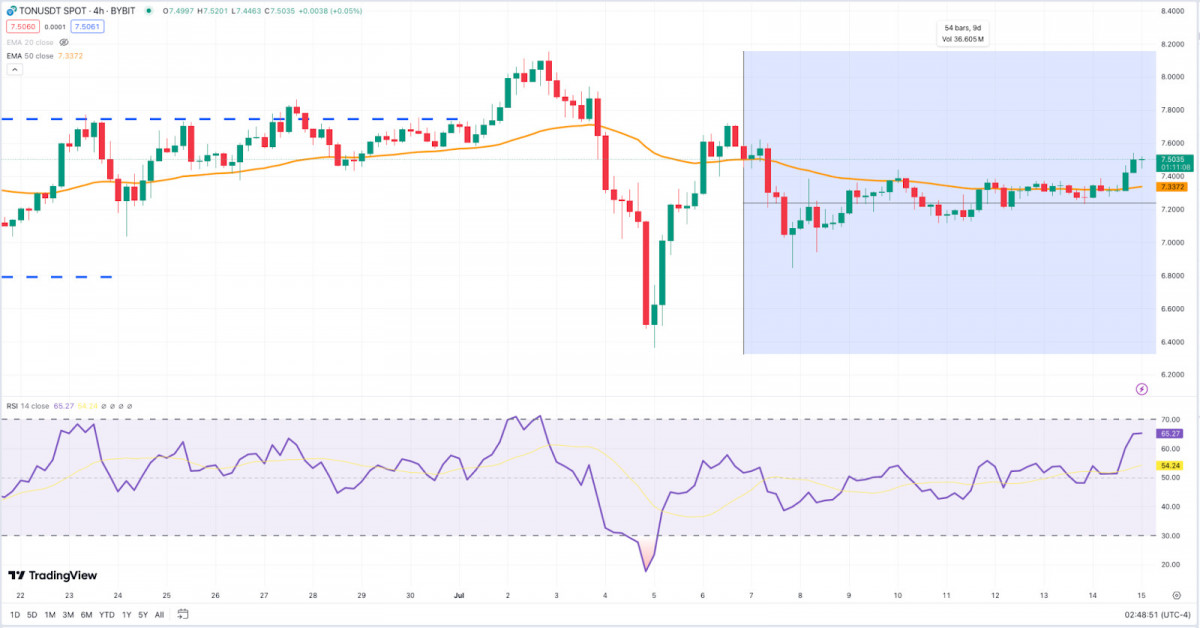
Source: TradingView
Following the $6.30 touch, TON also went into an accumulation phase. Surpassing the 50-EMA marked a bullish turn, confirmed by the RSI entering the overbought zone at 65.27. An ascending triangle pattern, with resistance at $7.15 and upward-moving lows, facilitated a breakout around July 12th.
A solid weekly close above $7.15 indicates consistent bullish interest, while daily closes above this mark suggest forthcoming price increases. These benchmarks align with the upward trends in Bitcoin and Ethereum. Key levels to monitor are $7.15 for support and $8.00 for the next significant resistance level. If the bullish momentum holds and prices remain above crucial moving averages, TON may retest and potentially surpass its previous highs. This ongoing momentum, along with the movements observed in Bitcoin and Ethereum, hints at a possible bullish turnaround for the overall crypto market.
Disclaimer
In line with the Trust Project guidelines Please be aware that the information shared on this page is not meant to be construed as legal, tax, investment, financial, or any other form of advice. Always invest only what you can afford to lose and seek independent financial advice if you have any uncertainties. For more details, we recommend reviewing the terms and conditions along with the help and support pages from the issuer or advertiser. MetaversePost is dedicated to delivering accurate and unbiased news, but market conditions can fluctuate without notice.