Weekly Cryptocurrency Insights: A Deep Dive into the Performance and Trends of the Top 3 Cryptos on the Market
In Brief
The crypto landscape saw notable price shifts, with Bitcoin hitting $71,000 and Ethereum reaching a market cap of $192 billion. Meanwhile, Toncoin has successfully made its way into Coin Wallet.
Bitcoin (BTC)
News & Macro
In the past week, Bitcoin's price experienced notable volatility, peaking at around $71,000 before settling back to around $69,000. This spike was driven by a significant influx of investments into Bitcoin ETFs, indicating a resurgence of investor confidence within the market.
At the same time, CleanSpark Inc., a prominent player in Bitcoin mining, reported stellar results for May, successfully mining 417 bitcoins while optimizing operations to increase capacity further.

Insights from CleanSpark’s Bitcoin Mining Report for May, Source: CleanSpark
The approval and subsequent launch of new cryptocurrency ETFs, particularly aimed at Ethereum, were pivotal in enhancing market activity, leading to increased capital flows and strengthening Bitcoin's market stability and growth outlook.
Price Analysis
Bitcoin's recent daily chart reflects a mixed sentiment, indicating some uncertainty in market trends compared to the preceding weeks.
On the daily chart, Bitcoin has been fluctuating within a narrow range of $69,000 to $70,800, with closing prices hovering around $69,386. The presence of long red candlesticks suggests a slight selling pressure as the market tries to find its footing.
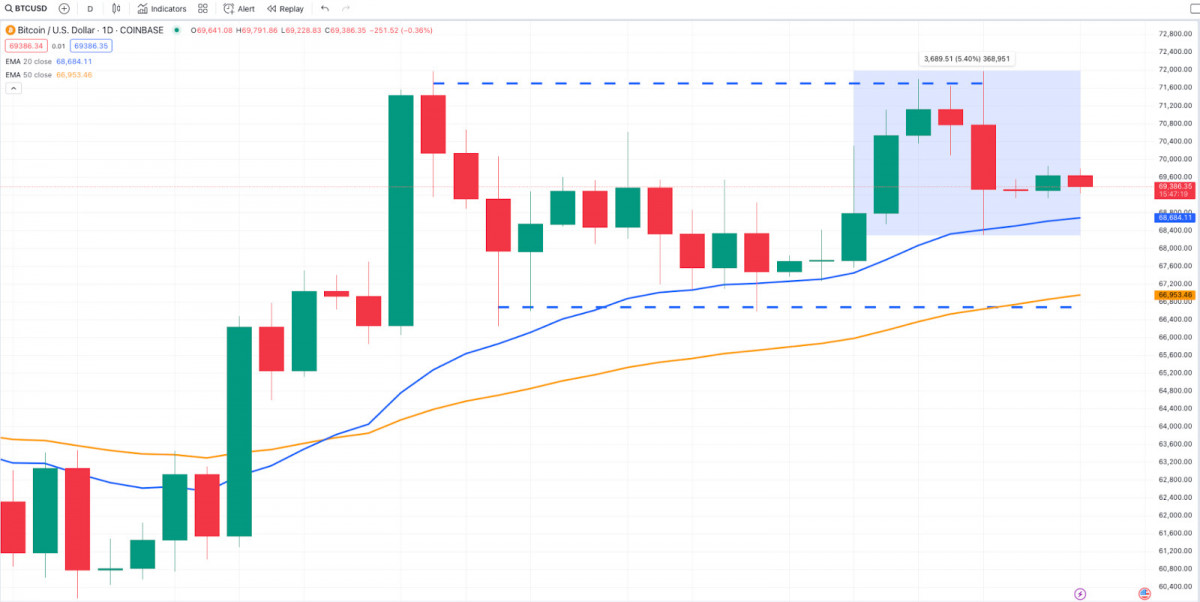
BTC/USD 1D Coinbase, source: TradingView
This phase of relative stability stands in sharp contrast to prior weeks marked by more dramatic price movements, including a significant spike to $71,000 fueled by strong buying interest.
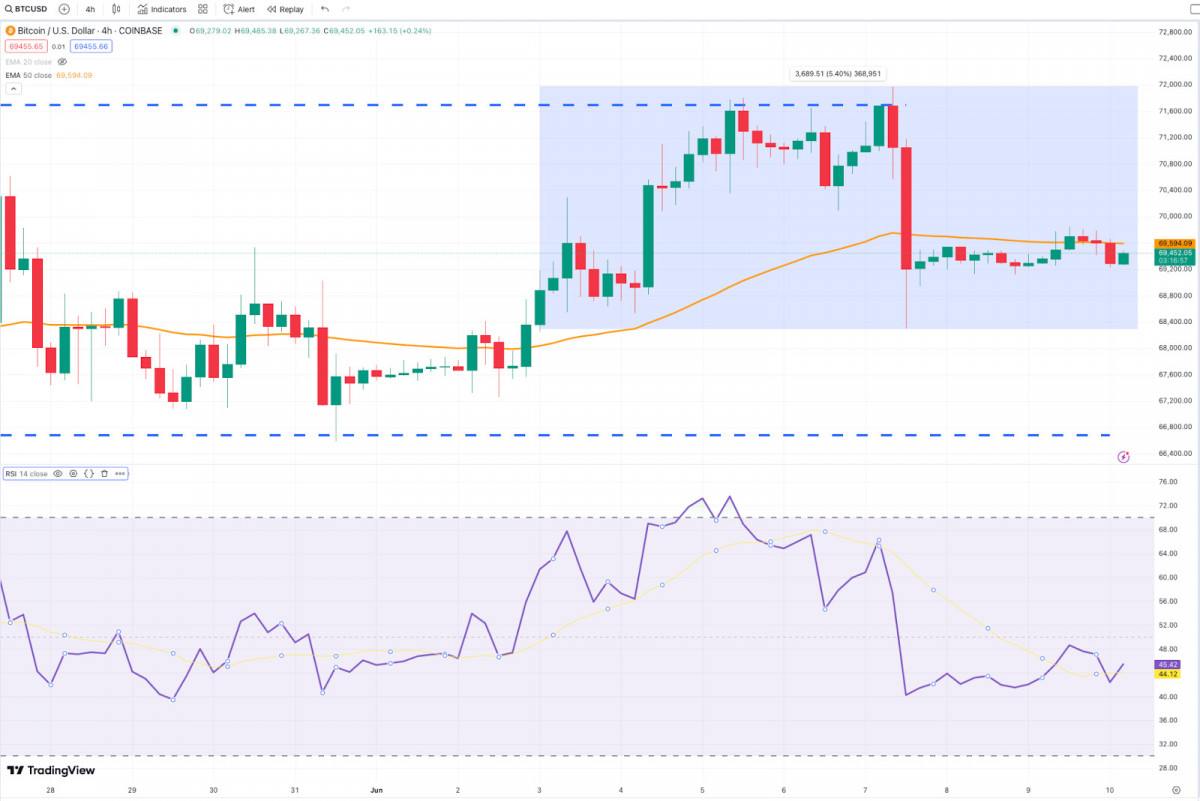
ETH/USD 4H Coinbase, source: TradingView
On the 4-hour chart, the trend of consolidation is even more pronounced, with trading activity centered closely around $69,000. The Relative Strength Index (RSI) is positioned near the neutral 50 level, indicating equilibrium between buying and selling forces, with no immediate signals suggesting the market is overbought or oversold.
Analyst bitcoinwallah from TradingView highlights the emergence of a symmetrical triangle breakout pattern on the 4-hour chart, suggesting that Bitcoin might rise to $75,000 if it can surpass the upper trendline.

Symmetrical Triangle Analysis for Bitcoin by bitcoinwallah, Source: TradingView
This analysis points to a market that could swing in either direction. A bullish breakout above the $70,800 resistance level could signify a resurgence of buying momentum, nudging prices towards $72,000. On the flip side, a dip below the $69,000 support could exacerbate bearish sentiment, potentially pushing the market down towards the $67,000 mark or the 50-day EMA support line.
Ethereum (ETH)
News & Macro
Ethereum, mirroring Bitcoin's trajectory, finds itself in a period marked by both expectation and trepidation. The decentralized finance (DeFi) sector has reached a new high of 15 months, with total value locked soaring to $192 billion, propelled by ETH's value increase and showcasing robust demand.
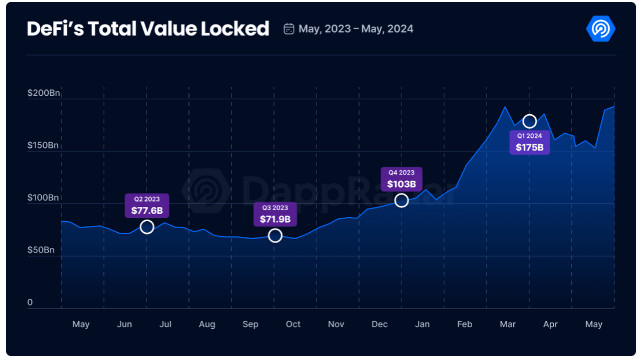
Total Value Locked in the DeFi Sector, source: DappRadar
Nonetheless, regulatory influences continue to shape market trends and affect investor sentiment. SEC Chair Gary Gensler has implied that the launch of a spot Ether ETF may take time. While these ETFs have received preliminary approval, they cannot begin trading until the required S-1 registration statements are formally accepted.
Gensler noted, “These registrants are self-motivated to respond to feedback, but their level of responsiveness is ultimately up to them,” as reported by Reuters on June 6. This stance reflects the current uncertainty surrounding ETH's future.
Additionally, the outcome of the recent EU elections could be pivotal, potentially influencing the regulatory landscape and paving the way for the launch of the first spot Ether ETF. However, there are positive developments within the Ethereum ecosystem that bring some hope.
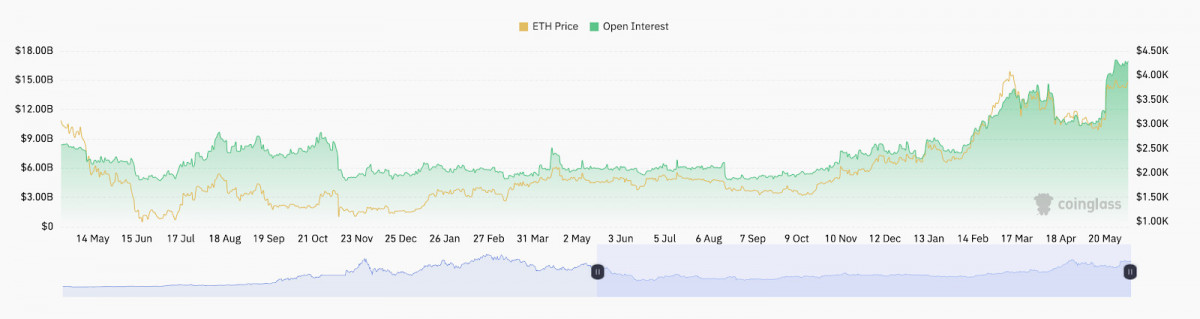
Open interest figures for ETH futures, source: Coinglass
The open interest in Ether futures and the trading volume of options have skyrocketed to all-time highs, signaling a surge in market activity. Moreover, a decrease in ETH reserves across cryptocurrency exchanges, along with increased institutional investments, has had a positive impact on Ether’s price.
In addition, Ethereum's layer-2 solution, Base, has successfully achieved $8 billion in total value locked, highlighting strong network activity and providing needed support for prices. These developments present a dynamic context for Ethereum's upcoming trajectory, balancing both optimistic and pessimistic influences.
Price Analysis
Over the past week, ETH’s price has settled into a narrow trading corridor, illustrating a market engaged in a fierce competition between buyers and sellers.
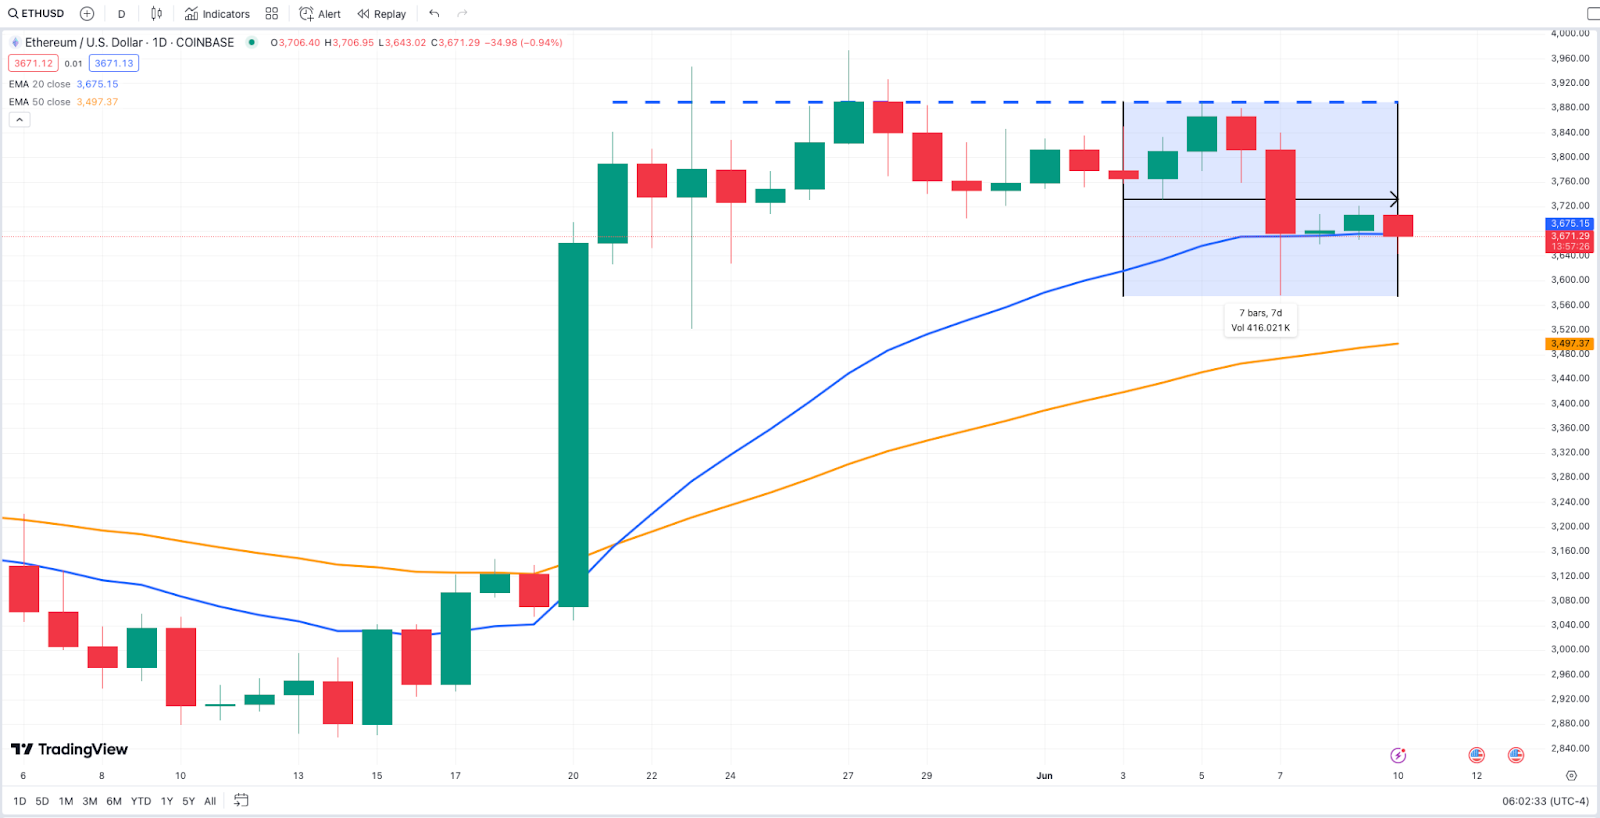
ETH/USD 1D Coinbase, source: TradingView
The daily chart showcases Ethereum oscillating between $3,700 and $3,800, with a recent close near the lower limit at approximately $3,671. This subtle dip signals a cooling-off phase after previous aggressive price movements that had pushed it above $3,900. A blend of green and red candles within this range points to a market standoff.
The 20-day EMA is presently trending slightly downward, hinting at a potential crossover with the 50-day EMA. A downward crossover could indicate a building bearish momentum, possibly resulting in lower prices in the upcoming days or weeks.
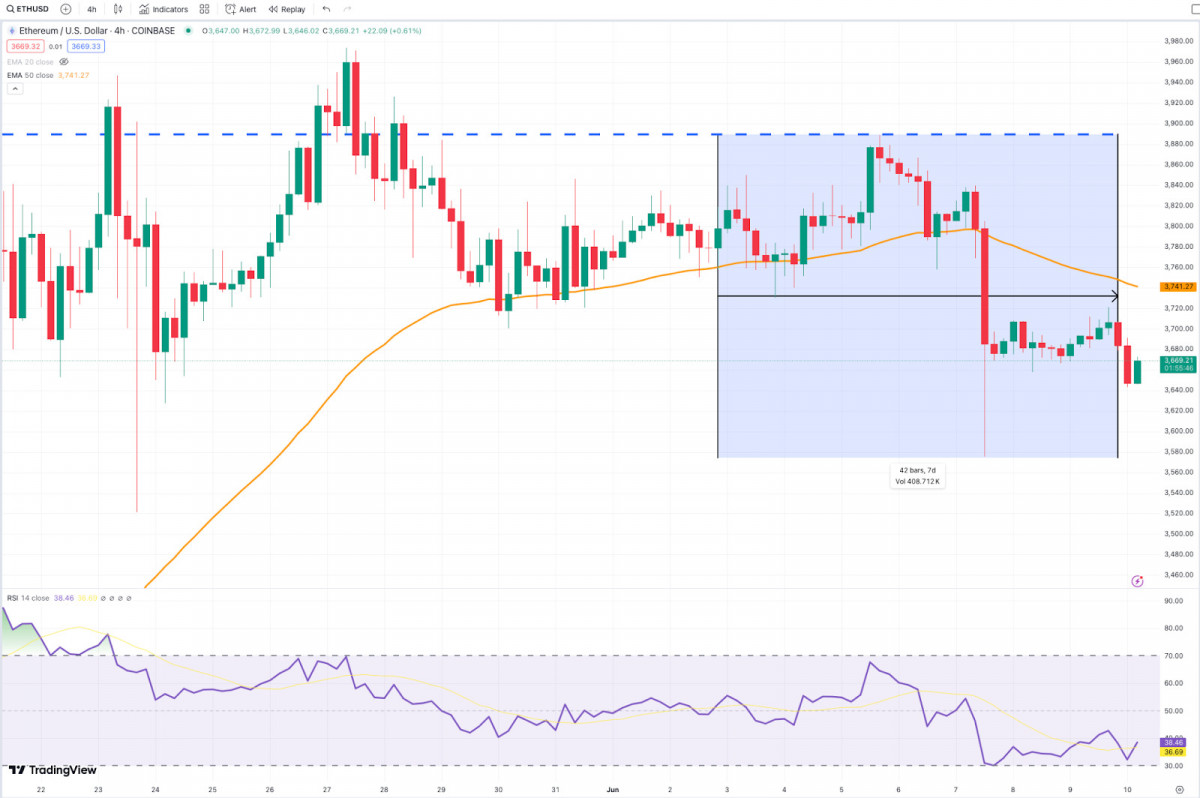
ETH/USD 4H Coinbase, source: TradingView
On the 4-hour chart, bearish trends are more pronounced while still primarily caught between the $3,660 and $3,760 range. Recently, the price dipped below the 4-hour 50-period EMA, indicating that short-term momentum is leaning bearish. This EMA has acted as a significant resistance, limiting upward movement, and aligns closely with the upper range limits. The RSI, sitting below the neutral threshold at around 38, further underscores the near-term bearish outlook.
Given the current market dynamics, Ethereum is positioned for potential decisive movements. A recovery above the 50-period EMA may signal a return to bullish conditions, with a possibility of challenging higher resistance levels near the recent peaks. In contrast, if prices keep respecting this EMA as a barrier and the RSI remains subdued, further declines may occur, with the next support likely appearing at lower levels from past trading history.
Toincoin (TON)
News & Macro
The last week has been transformative for the TON blockchain, marking major strides in the global integration and adoption of cryptocurrencies. Toncoin (TON) is now integrated into the Coin Wallet, a popular non-custodial multicurrency wallet that works across a variety of platforms, including Android, iOS, macOS, Linux, Windows, and Web.
In line with this, American brokerage Robinhood has included TON in its crypto services for users in the European Union. Additionally, the TON Foundation and Tether have initiated a considerable initiative, set on forming over 100 global partnerships to integrate USDT onto the TON blockchain.
Technologically, the launch of the Algebra DEX engine stands out, representing a significant leap for decentralized exchanges by greatly enhancing liquidity management on the TON blockchain, supporting more than 25 exchanges with a total trading volume surpassing $245 million and a turnover of $52 million.
Price Analysis
On the daily chart, Toncoin has shown stability, demonstrating a gradual upward trend over recent weeks.
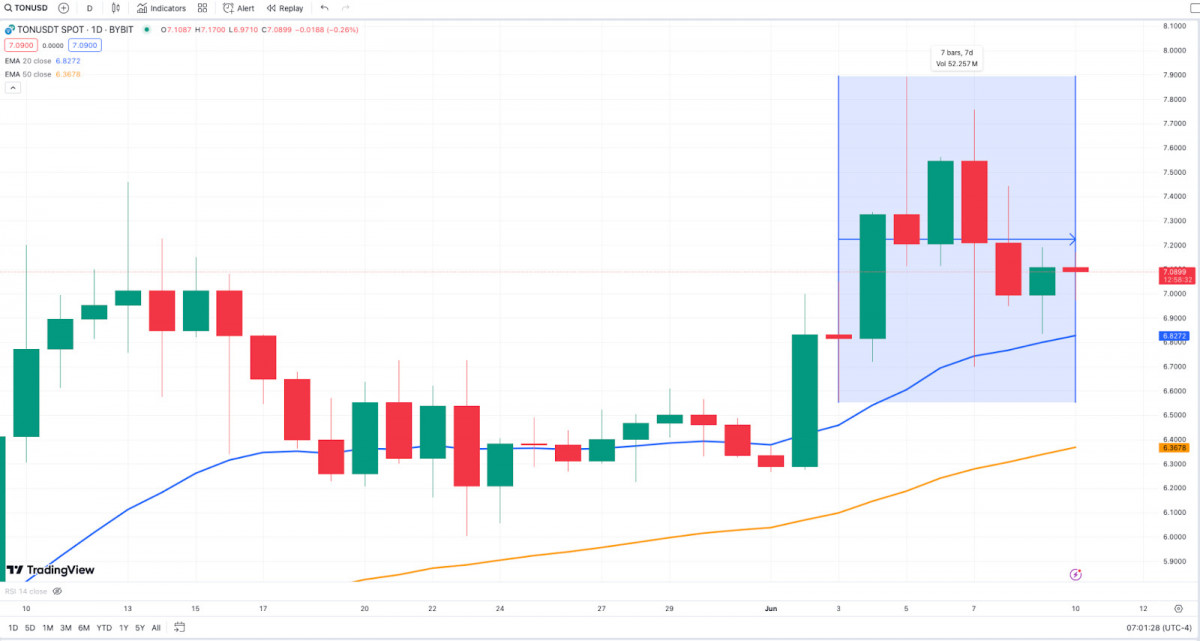
TON/USD 1D ByBit, source: TradingView
Currently, Toncoin (TON) has been maintaining a gradual upward trajectory over the past few weeks according to the daily chart, hovering around $7.00, with a close at $7.09. This steady performance follows a robust surge where the price hit $7.70, indicating a solid bullish momentum.
However, in recent days, the market has entered a downtrend, characterized by long red candles that indicate selling pressure. The price has retreated towards the critical psychological support level of $7.00. The 50-day EMA at $6.63 serves as essential support should the downward trend persist. Despite this, maintaining a position above the EMA speaks to underlying bullish sentiment, although the tightening price action with small candlestick bodies signals trader uncertainty.
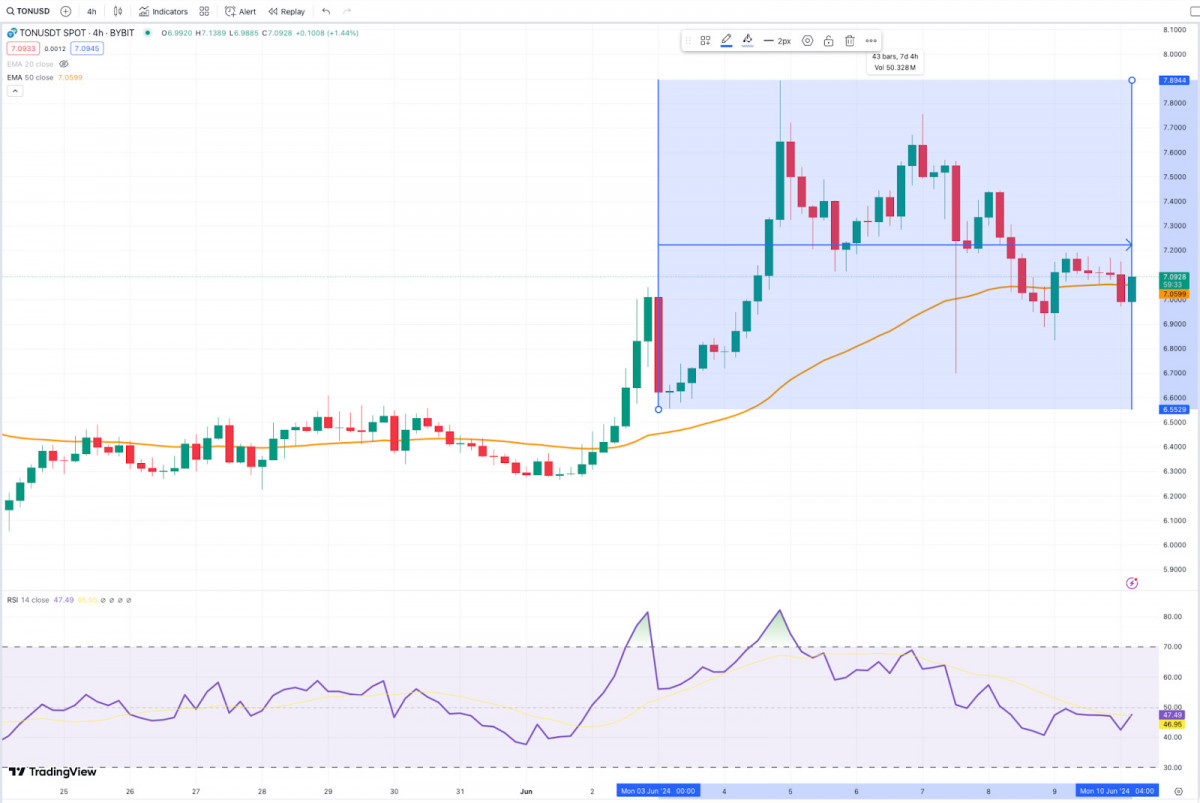
TON/USD 1D ByBit, source: TradingView
On the 4-hour chart, Toncoin's challenge in sustaining bullish momentum becomes more evident. After reaching a peak of $7.50, it has slipped back to $7.03, frequently testing within the range of $7.00 to $7.50. The EMA serves as a dynamic support, closely following the price movement.
The RSI on the 4-hour chart, trending around 46, suggests a retreat from previously overbought conditions, possibly readying for consolidation or preparation for another upward advance if buying interest strengthens.
In conclusion, Toncoin currently finds itself at a pivotal point. The upcoming market movements will depend on several key factors: should Toncoin maintain its support above the $7.00 level and rebound off the 50-day EMA on the daily chart, it could mean a retest of previous highs around $7.70. Conversely, a breach below this essential support level might lead the price to test lower toward the $6.50 area, highlighting the importance of the $6.63 EMA as a crucial zone for traders to monitor.
Disclaimer
In line with the Trust Project guidelines Please be reminded that the information provided on this page is not intended as legal, tax, investment, financial, or any other form of advice. It's crucial to invest only what you can afford to lose and to seek independent financial advice if you have any uncertainties. For additional details, we recommend reviewing the terms and conditions and referring to the support resources provided by the issuer or advertiser. MetaversePost strives for accuracy and impartial reporting, yet market conditions can change rapidly without notice.