This week's crypto recap highlights Bitcoin's current struggles, Ethereum's positive performance, and Toncoin's steady presence.
In Brief
This week’s crypto report highlights Bitcoin’s challenges, with its significant price drop to $64,000 amid market pressures, Ethereum gaining traction after SEC news, and Toncoin's steadiness despite volatility, featuring in-depth price analyses, macroeconomic factors, and institutional activities in the blockchain domain.
Bitcoin News & Macro
Bitcoin experienced a significant decline, falling to $64,000, marking a new monthly low and keeping traders on alert. Large investors are buying in, evidenced by exchange reserves hitting a three-year low, but the market remains uneasy without signs of a rapid recovery. A recent 2.8% dip, prompted by whale activity as Bitcoin neared $66,500, deepens bearish sentiments and exacerbates the struggle to hold the $64,000 line.
The prevailing pessimistic market sentiment is being fueled by the Federal Reserve’s stringent policies and substantial withdrawals from U.S.-based Bitcoin ETFs, with a staggering $600 million leaving the market on June 14 – the largest outflow since March.
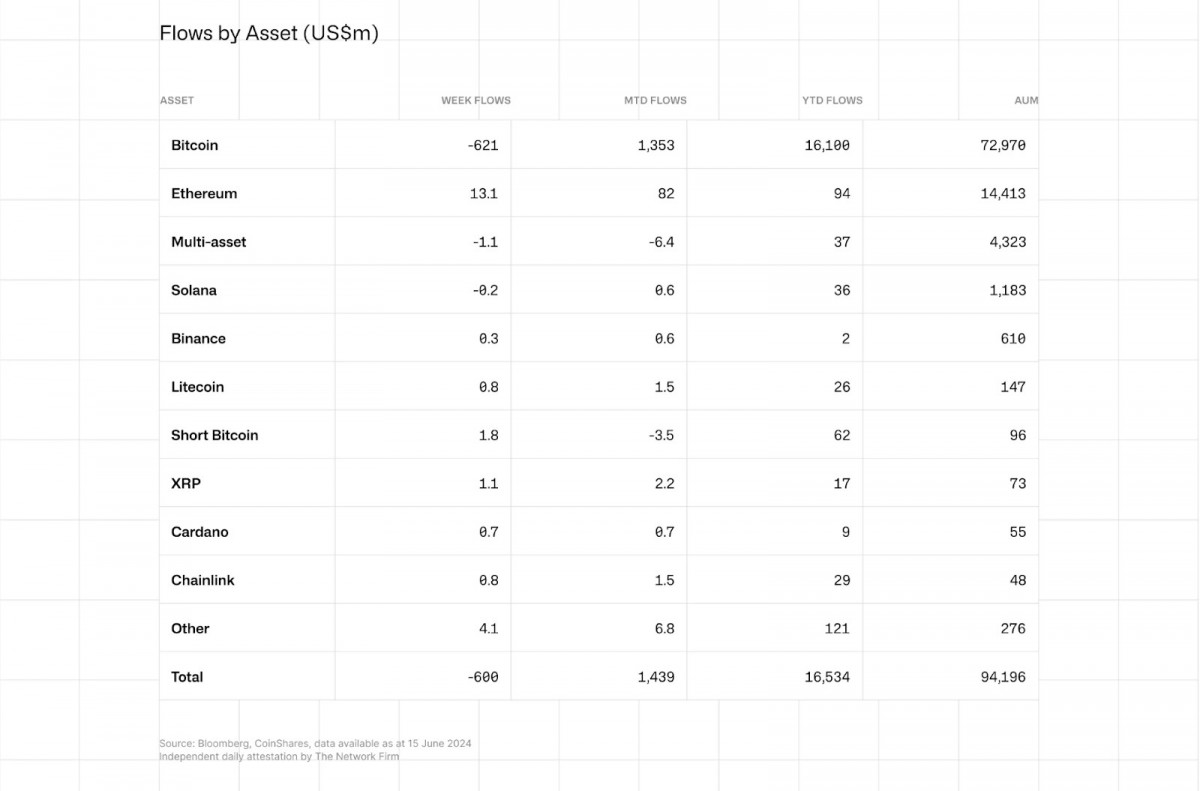
A detailed analysis of asset inflows and outflows. Source: CoinShares Weekly Fund Flows Report
This trend of financial outflow puts intense pressure on Bitcoin's price, particularly with the Fed signaling a move towards higher interest rates, which in turn makes riskier assets like Bitcoin seem less appealing. While Bitcoin has managed to outperform the S&P 500 by a remarkable threefold in 2024, this has not been enough to halt a wave of selling.

Source: Michael Saylor (X/Twitter)
Despite the downturn, some players view the lower Bitcoin prices as attractive buying opportunities, as evidenced by MicroStrategy's $800 million bond offering aimed at acquiring more Bitcoin.
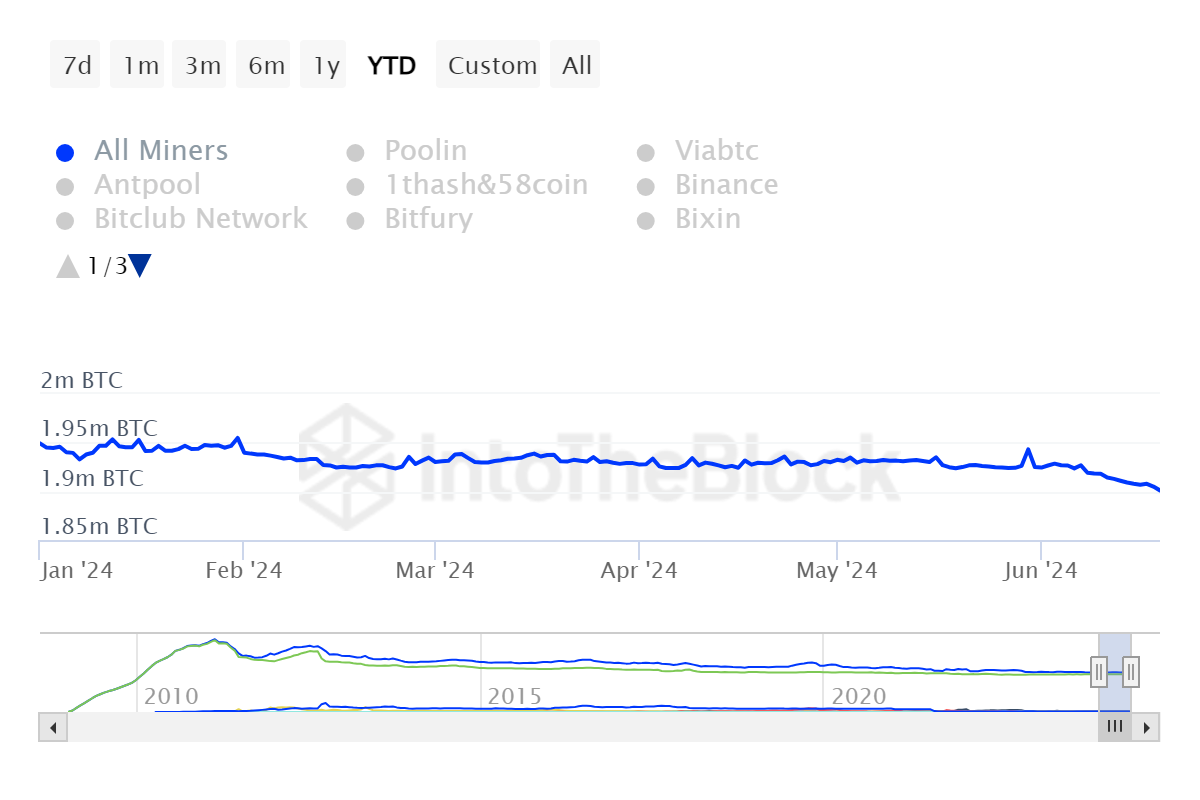
Bitcoin miners are holding their smallest reserves since February 2010. Source: IntoTheBlock
Moreover, Bitcoin miners currently possess the least amount of Bitcoin since 2010, signaling a possible supply crunch that could further impact market dynamics.
High-stakes transactions are also creating turbulence in the already shaky market. There are significant movements like Michael Dell’s $2.1 billion Bitcoin sell-off and substantial political donations from the Winklevoss twins, which both contribute to short-term market fluctuations. Despite the chaotic price trends, it appears that political figures are increasingly associating themselves with cryptocurrency, indicating a rise rather than a pullback in crypto involvement.
BTC Price Analysis
Looking back at Bitcoin's recent charts, it displays signs of a classic sell-off, with prices breaking through levels that previously provided solid support. Here's a brief overview of the current situation:
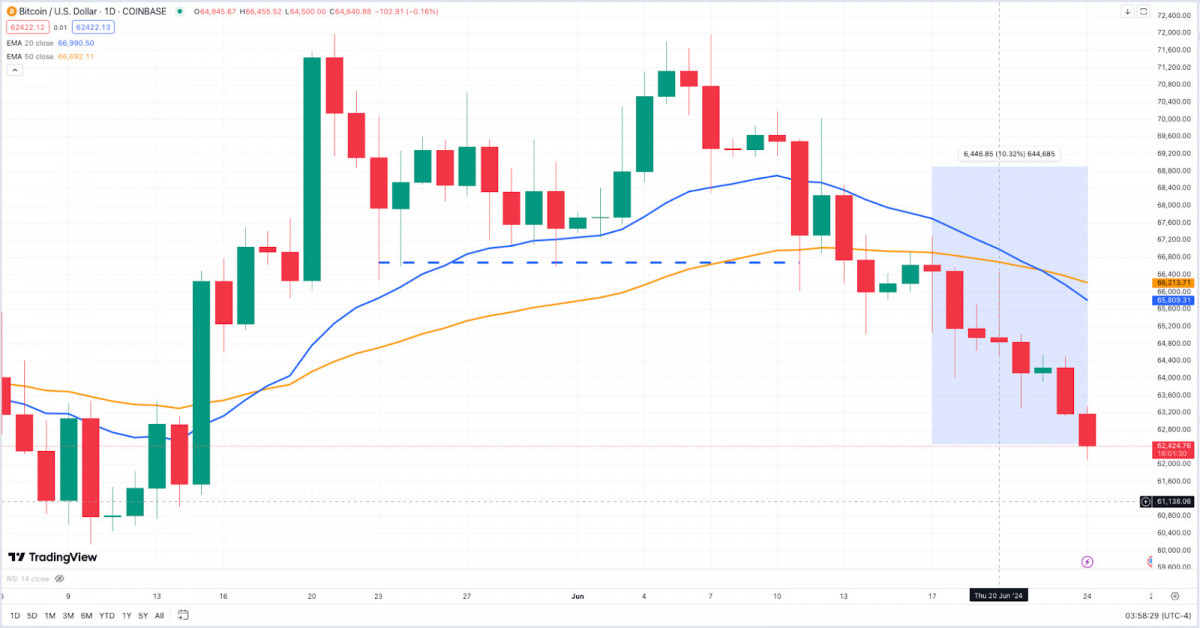
BTC/USD 1D Chart, Coinbase. Source: TradingView
The daily chart reveals that Bitcoin is in a precarious position, having slipped below a support level that had previously stood strong for weeks. Prices fell from around $66,000 to just under $62,000, characterized by a series of long red candles. The crossing of the 20-day and 50-day EMAs raises alarms for Bitcoin bulls, suggesting that this downturn may linger unless strong buying activity emerges to propel prices upward.
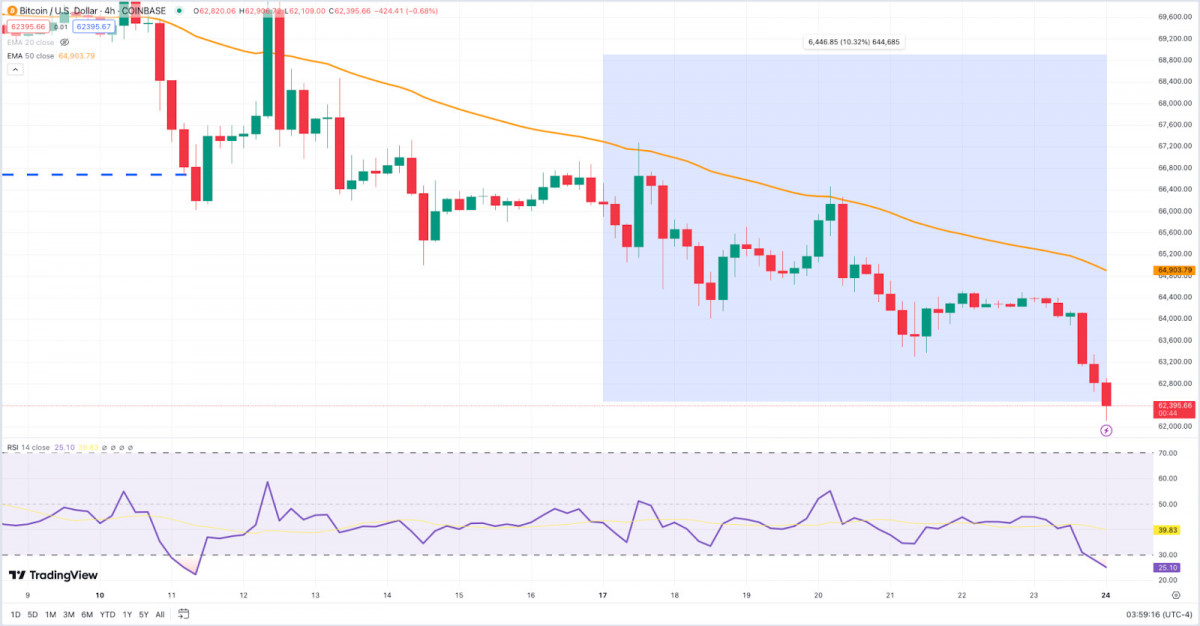
BTC/USD 4H Chart, Coinbase. Source: TradingView
Examining the 4-hour chart, the price drop gets a more detailed analysis. The 50-EMA has effectively turned into a barrier that Bitcoin struggles to overcome, and every effort to rally has been met with stiff resistance.
The Relative Strength Index on this shorter timeframe has dipped below 30, indicating an oversold condition. However, it’s essential to temper optimism – without a robust push from buyers, these low RSI levels merely showcase the extent of the sell-off.
That once-reliable support line we've been monitoring has transformed from a protective barrier for bulls into an obstacle on Bitcoin’s path to recovery. Notably, trading volumes during this decline have been substantial, indicating strong backing for the drop.
Traders should stay vigilant for any indicators of market stabilization or price patterns that might hint at a reversal. However, with those EMAs hovering above on the daily chart, any uptick will have to overcome significant challenges.
In summary, it's been a turbulent week for Bitcoin, dominated by bearish trends and key indicators urging caution.
Ethereum News & Macro
Ethereum has also experienced its own share of volatility this week. After the SEC concluded its investigation into Ethereum, Ether’s price benefited from the positive news, surpassing $3,500. This surge in sentiment indicated strong market support, but, similar to Bitcoin’s struggles around $64,000, Ethereum was unable to maintain its upward trajectory.
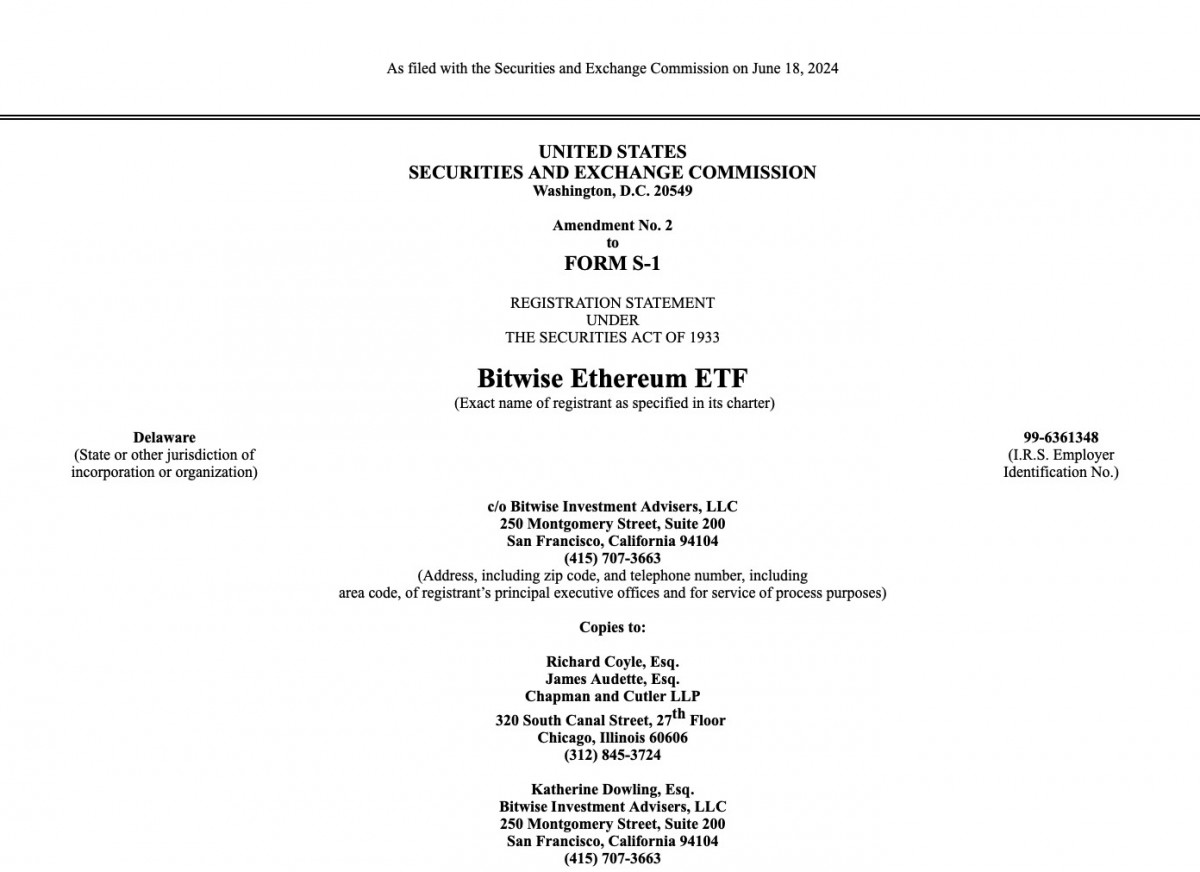
Furthermore, Bitwise has refreshed its Ethereum ETF application with Pantera, which is looking to invest up to $100 million. Alongside MicroStrategy's sizable Bitcoin note offering, this suggests that institutional interest remains robust.
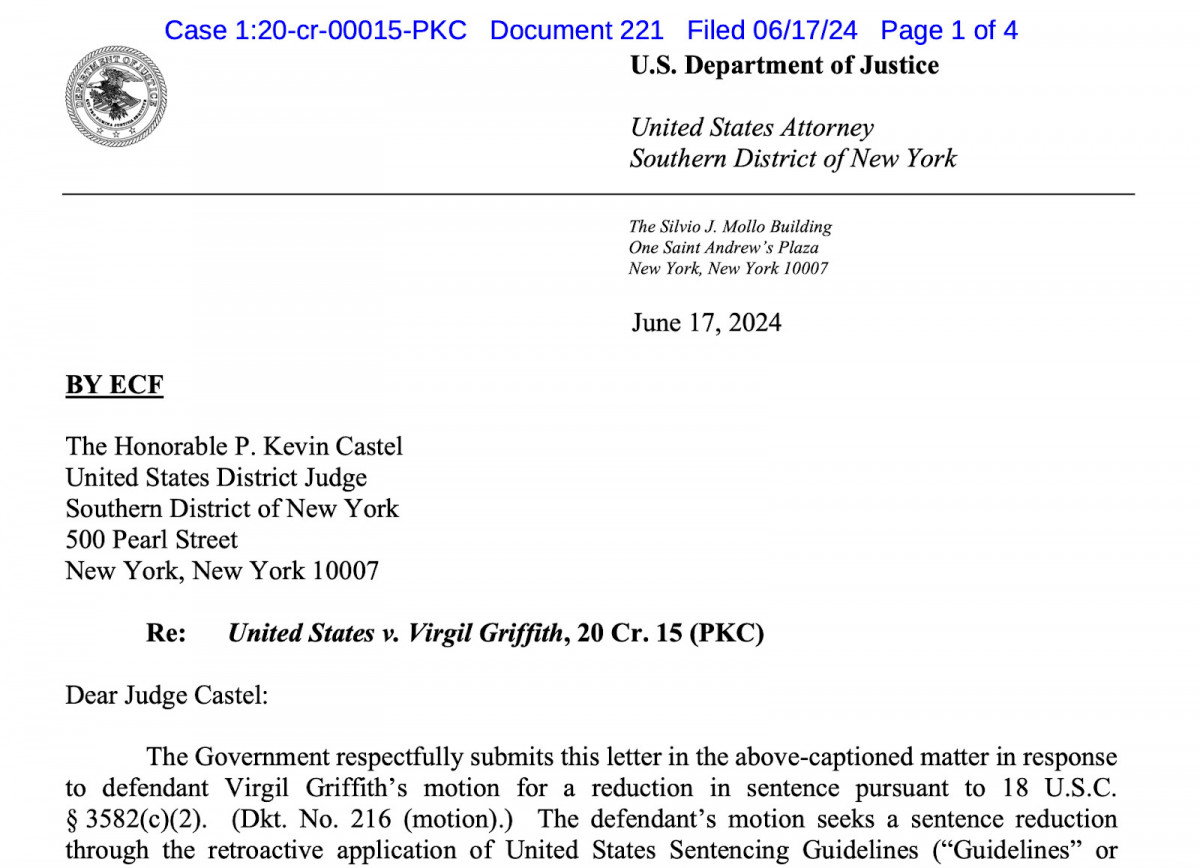
June 17 court filing opposing the request for a sentence reduction for Virgil Griffith. Source: PACER
Nevertheless, not all the news was promising last week. U.S. federal authorities opposed a reduced sentence for Ethereum developer Virgil Griffith, reminding us that ongoing legal risks could hold traders back from taking action.
Ultimately, the future of Ethereum hinges on breaking through current resistance levels and maintaining upward growth, just as Bitcoin needs to aim for a hypothetical breakout to $90,000.
Overall, Ethereum's performance is still closely linked to the broader market dynamics, including Bitcoin’s fluctuations. Cumulatively, various factors are making it challenging for ETH to remain above $3,500.
ETH Price Analysis
Tracking Ethereum’s daily movement shows a consistent downward trend under the weight of the prevailing bear market. There aren't any elaborate formations to note this time – just a straightforward descent as sellers take control.
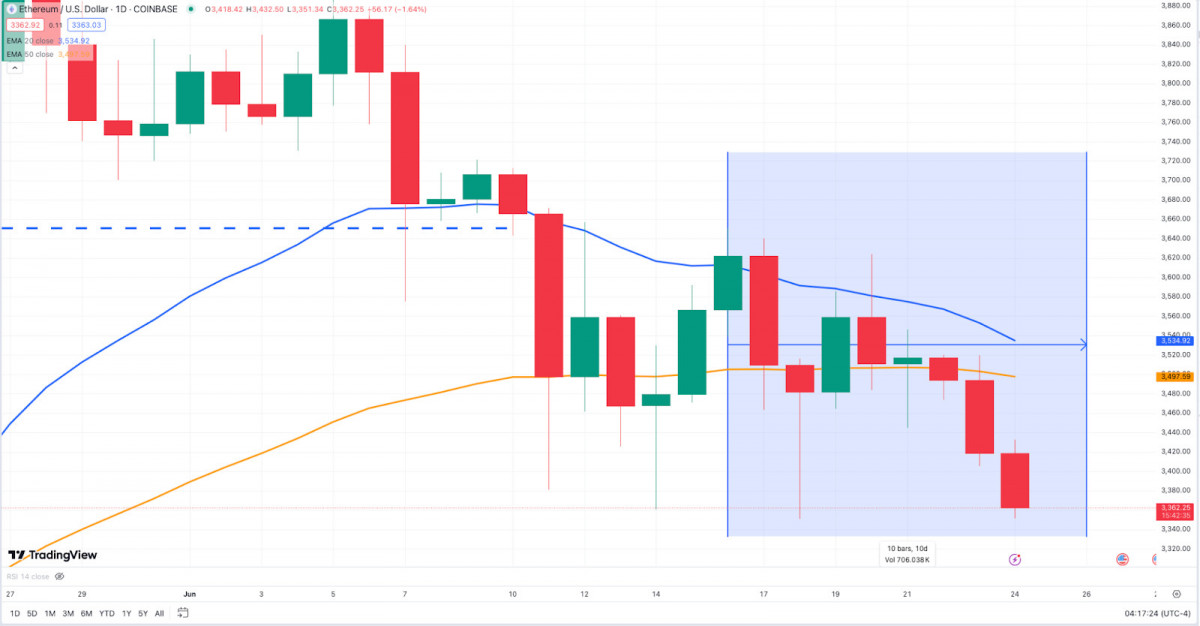
ETH/USD 1D Chart, Coinbase. Source: TradingView
Echoing Bitcoin’s sentiments, Ethereum has also disengaged from its previous support levels. The interaction between the 2-EMAs adds complexity to the narrative. Initially closely tracking the 20-EMA, ETH stumbled and continued to plunge beneath the 50-EMA. This bearish crossover, where the 20-EMA dipped below the 50-EMA, practically set the scene for the downturn. The spike in volume during ETH’s recent decline underscores that this was not a mere drift but an active downward push.
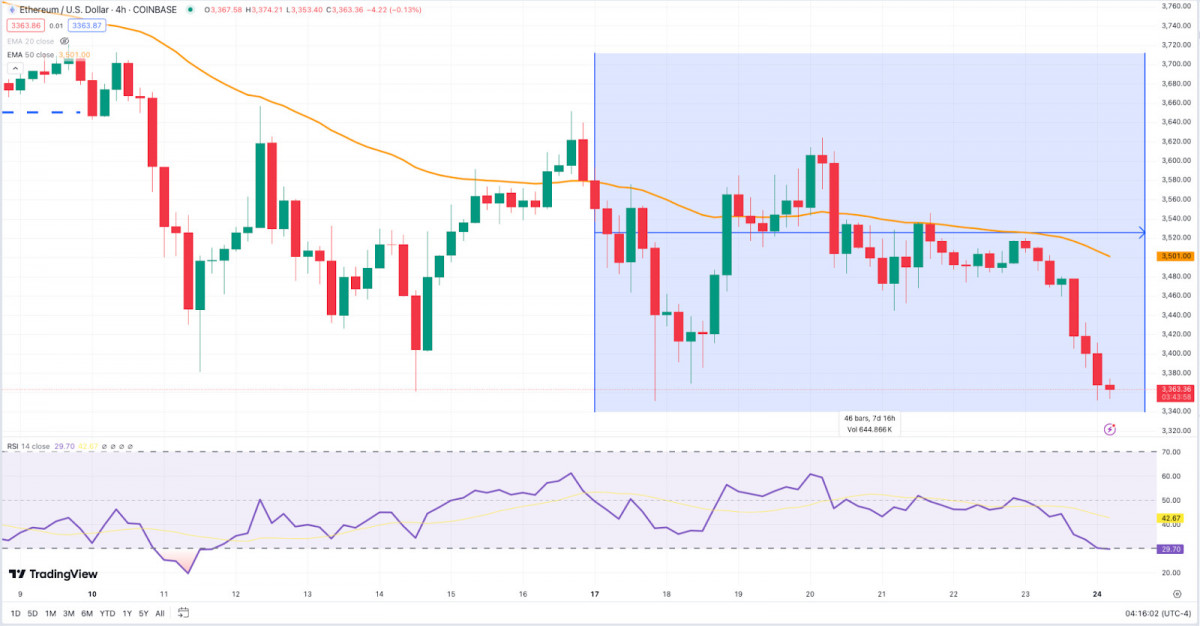
ETH/USD 4H Chart, Coinbase. Source: TradingView
If we zoom into the 4-hourly timeframe, Ethereum's situation doesn't look particularly promising either. Once it couldn’t sustain the dashed support at $3,650, ETH took a nosedive, indicating that bearish sentiment is firmly in control. While hovering around the 50-EMA, each attempt to break through was thwarted, sending ETH lower. The RSI nearing 30 signals an oversold market, but there’s no sign of any bullish action to turn things around. Key resistance for ETH now rests at those EMAs, likely becoming crucial battlegrounds for any upcoming recoveries.
For traders, this is a time to monitor the EMAs for indicators of a bullish crossover or a stabilization of the RSI on the 4-hour chart, which could signal a potential easing of the selling pressure. As always, the trick will be identifying the right moment to ride the wave if favorable conditions return.
Toncoin News & Macro
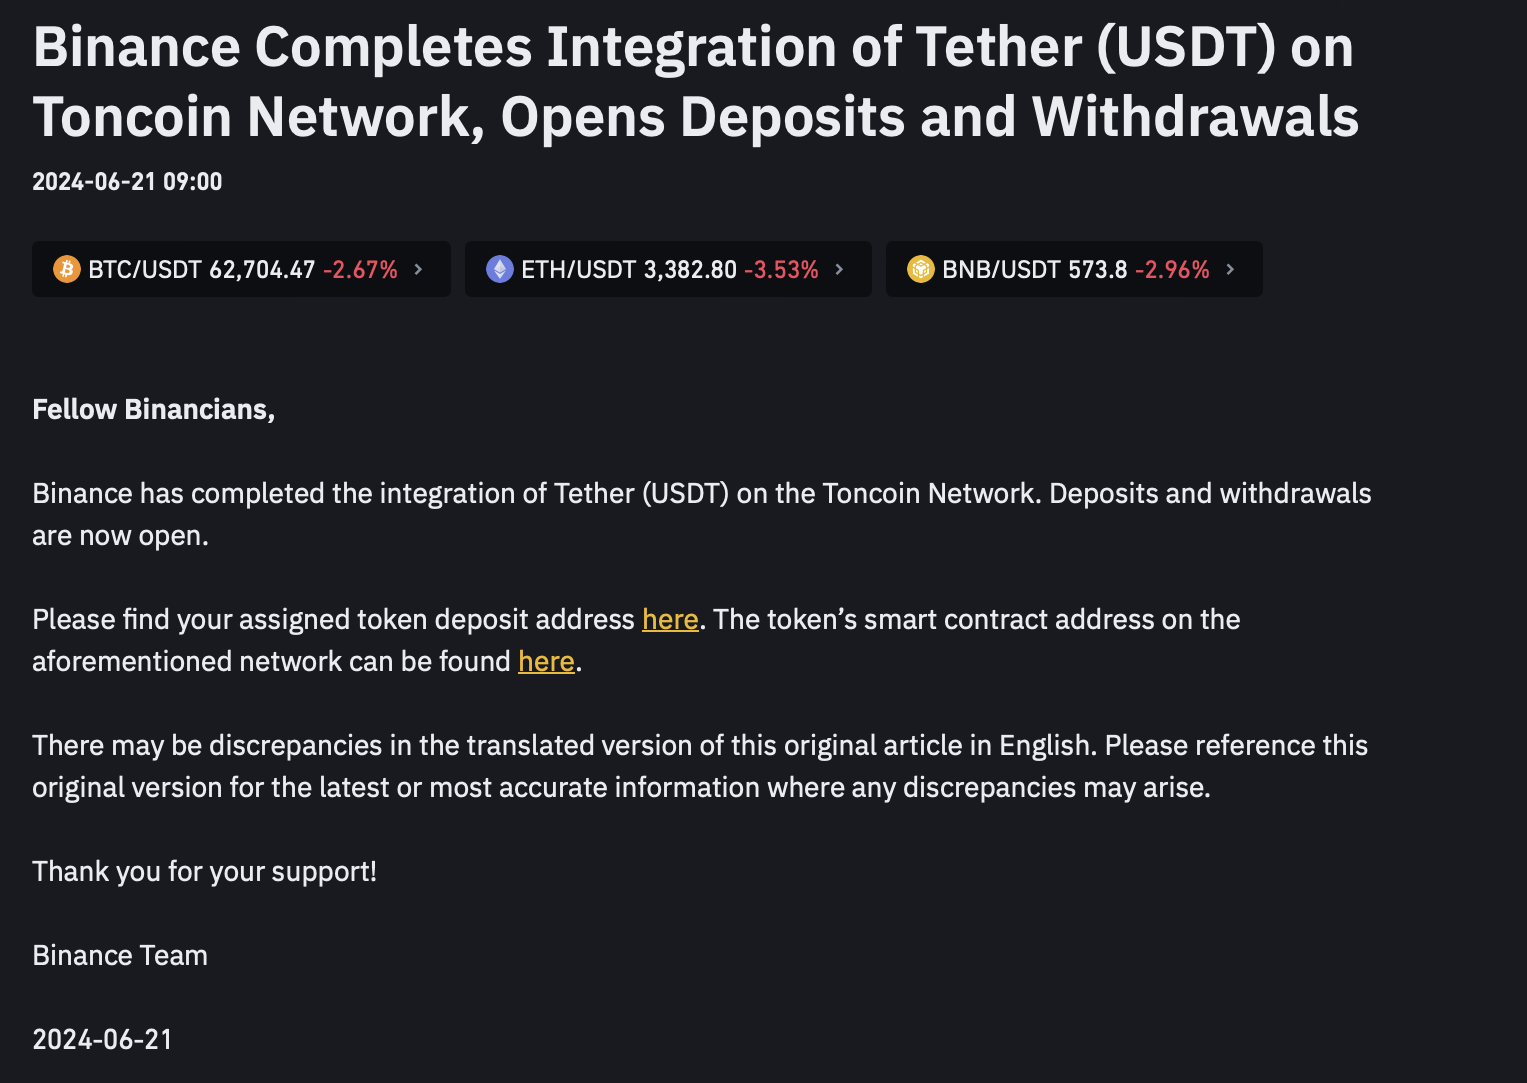
Toncoin’s week mirrored this volatility as well. Notably, Binance approving USDT transfers on the TON blockchain solidified its presence within the institutional framework. Such integrations usually lead to increased liquidity and reduced transaction costs, a positive sign for Toncoin investors.
Source: Binance
Moreover, there's buzz surrounding Toncoin’s innovative approach to cross-chain swaps. This strategy could set it apart in the market and contribute to its future growth potential, much like the optimistic predictions surrounding Ethereum and Bitcoin.
However, overall economic uncertainties and liquidity challenges continue to shake the entire crypto space, leading to price fluctuations in TON as it follows larger cryptocurrencies.
TON Price Analysis
Despite TON reflecting the bearish trends seen in BTC and ETH, it exhibits some subtle strength by maintaining its position better than its counterparts. Let’s dive into TON's price movements over the last week.
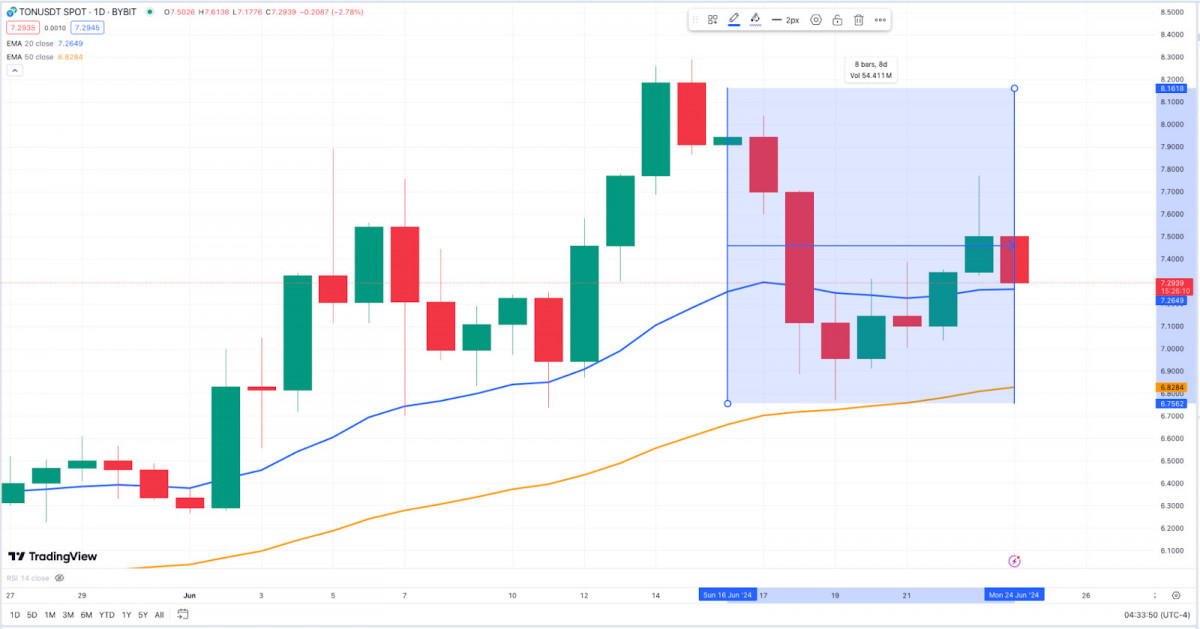
TON/USD 1D Chart, ByBit. Source: TradingView
On the daily chart, TON had a roller-coaster week, oscillating between bullish and bearish territories. Following an impressive rise early in the week, TON experienced a sharp retracement, dropping from heights near $8.20 down to about $7.20. This decline mirrors the overall sentiment affecting ETH and BTC, where temporary rallies were swiftly sold off.
Initially, TON hovered around the 20-day EMA early in the week, reflecting some buying interest, but this enthusiasm faded quickly, and prices slipped below the 20-EMA. Mid-week, as TON dropped under the 20-EMA, it indicated a bearish shift; however, unlike BTC and ETH, it has yet to breach the 50-EMA, suggesting a bit more resilience or possibly a slower reaction to overarching market pressures.
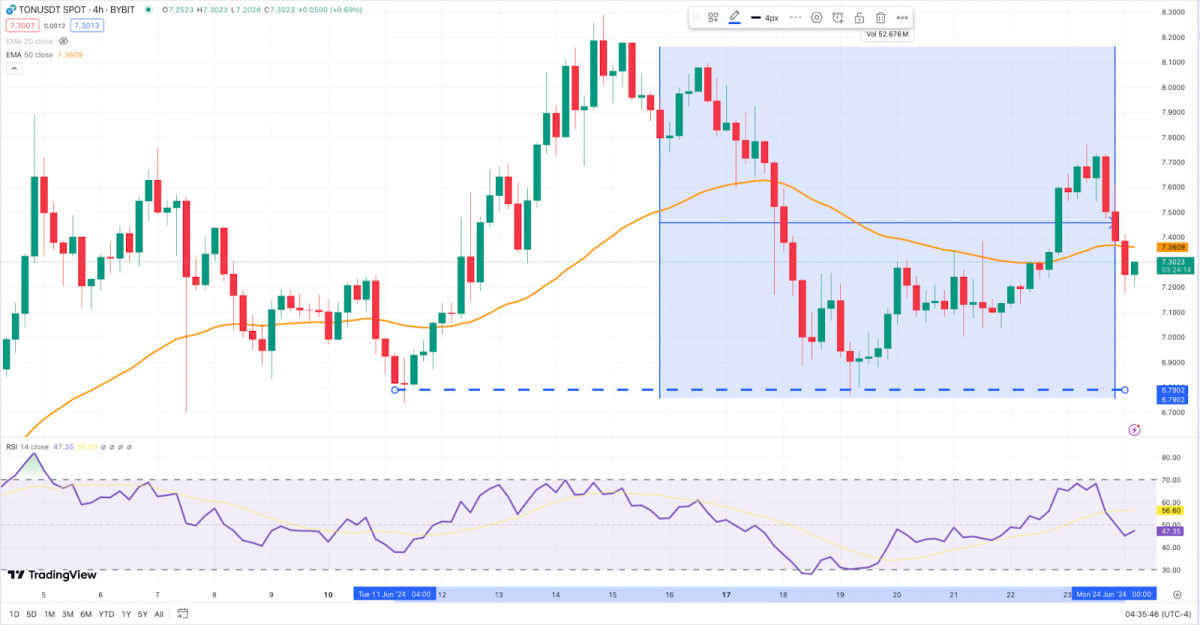
TON/USD 4H Chart, ByBit. Source: TradingView
The 4-hour chart highlights the ongoing battle at the 50-EMA, which has effectively served as a resistance level, stifling any bullish attempts to stage a full recovery from the recent declines. Every upward move faced pushback, with the RSI remaining below the 50 threshold for most of the week, signaling that sellers were in control—similar to what we've witnessed with ETH. That said, TON's RSI didn’t plunge into dangerously oversold levels like ETH and BTC, indicating that while there was continued selling pressure, it wasn't overwhelmingly intense. Over the weekend, there was a brief moment when the price broke above the 4-hour 50-EMA, but this was short-lived as TON quickly fell back beneath this key level, still struggling to establish a solid base.
To sum it up, in contrast to BTC and ETH, which displayed evident bearish crosses in their EMAs alongside pronounced downtrends, TON managed to stay above its pivotal 50-EMA on the daily chart, providing a glimmer of optimism for those supporting a price rally. A sustained move above the 20-EMA could signal a potential buildup of bullish momentum worth monitoring.
Disclaimer
In line with the Trust Project guidelines It's crucial to clarify that the details offered on this page are not meant to function as legal, tax, investment, financial advice, or anything of that nature. Only invest what you can afford to part with, and if you're uncertain, it’s advisable to seek independent financial counsel. For additional details, we recommend checking the terms and conditions as well as the support resources provided by the issuer or advertiser. At MetaversePost, we strive for precise and unbiased reporting, but please keep in mind that market conditions can shift unexpectedly.