Weekly Crypto Update: Market Dynamics and Future Price Forecasts for BTC, ETH, TON
In Brief
In the last week, Bitcoin has faced downward pressure due to significant sell-offs led by creditors of Mt. Gox and actions taken by the German government. Meanwhile, Ethereum struggled with bearish trends even though there was notable activity in decentralized applications and a growing anticipation for Exchange-Traded Funds (ETFs). On the other hand, Toncoin experienced a notable price increase fueled by innovative blockchain projects and initiatives in gaming. However, it too found itself challenged in a market largely dominated by negative sentiment.

Bitcoin News & Macro
Here's a summary of the factors influencing Bitcoin's price over the past week. The situation surrounding Mt. Gox escalated as creditors moved massive quantities of Bitcoin, shaking the confidence of investors in the market. With over $2.7 billion worth of Bitcoin transferred to a new wallet, concerns about impending large-scale sell-offs became prevalent.
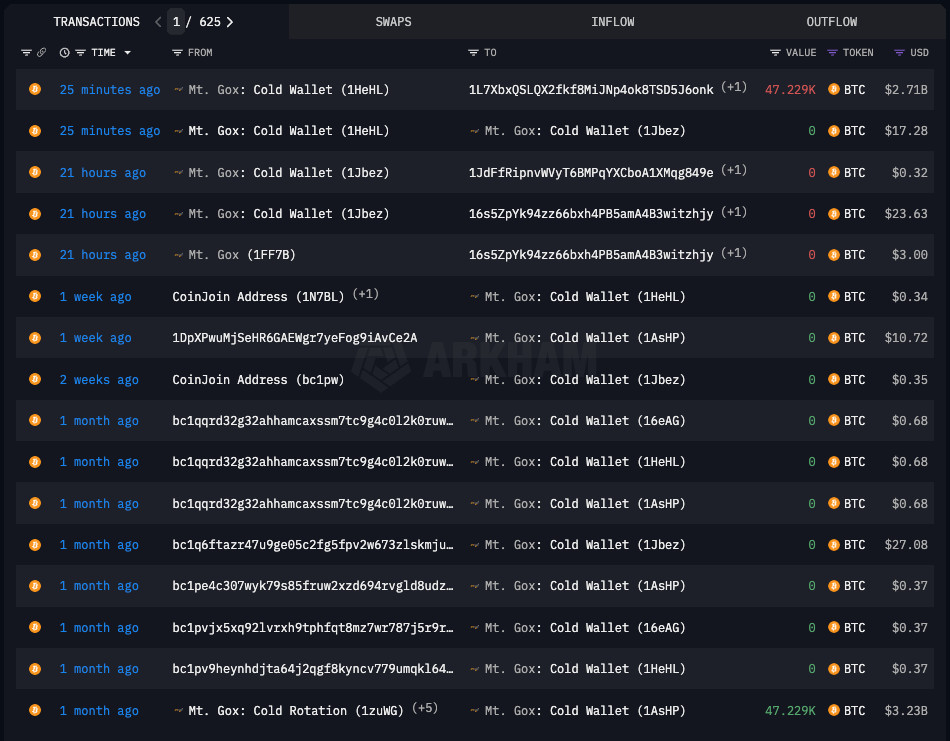
Source: Arkham Intelligence
To compound the pressure, the German government continued its Bitcoin liquidation, offloading more than $2.3 billion.

Source: Arkham Intelligence
This consistent influx of supply severely affected market sentiment, causing traders to brace for further downturns as the selling trend persisted.
Amidst the negativity, a few optimistic signals appeared. Analysts suggested that there might be a chance for recovery with the expected approval of Bitcoin ETFs. However, doubt remains, particularly due to tepid technology earnings and overarching economic challenges clouding any optimism.
BTC Price Analysis
With that context, let’s briefly overview BTC's price movements since July 1. A steep sell-off initiated the week, breaking downward from the $63,000 threshold and slicing through the crucial $60,000 support level, hitting a low around $54,000. This price point became crucial as buyers stepped in to take advantage of what they perceived as discounted BTC.

Coinbase. Source: TradingView
Nonetheless, the recovery faced significant resistance just shy of $58,000, coinciding with the 50-exponential moving average (EMA) on the 4-hour chart. This area served as a barrier, confirmed by the RSI remaining in the bearish zone, failing to consistently rise above the midpoint.

Source: TradingView
Examining the daily chart, the recent sell-off aligns with a broader downtrend that commenced in mid-June. The daily candles depict a sequence of lower highs and lower lows, typical indicators of a bearish market structure. The EMAs reinforce this bearish trend, with the 20-EMA dropping below the 50-EMA, indicating further potential declines.
Source: TradingView
The drop from $63,000 revisited early March support levels, with $55,000 emerging as a crucial pivot point. This level, which previously acted as both support and resistance, became a psychological reference for traders. Closing below this mark on a daily basis intensified bearish sentiment, spurring additional selling pressure. Following last week's open around $60,000, which quickly turned resistance, daily closes below $58,000 reinforced a bearish outlook. This dynamic led to further breakdowns, interspersed with brief consolidation phases followed by more selling.
Looking ahead, traders should monitor the $55,000 support zone. A breach below this marker could set off a further decline, targeting levels around $52,000 and $50,000. Regaining $58,000 would serve as a positive indicator, with $60,000 becoming the next significant hurdle.
Ethereum News & Macro
Over the past week, Ethereum (ETH) has unfolded as a storyline of contradictory bullish aspirations and lingering bearish concerns. Notably, the volume of DApps surged by 83% owing to a single application fueling network engagement. Yet, the surprisingly low fees for both Bitcoin and Ethereum have raised questions regarding the overall stability of the market.
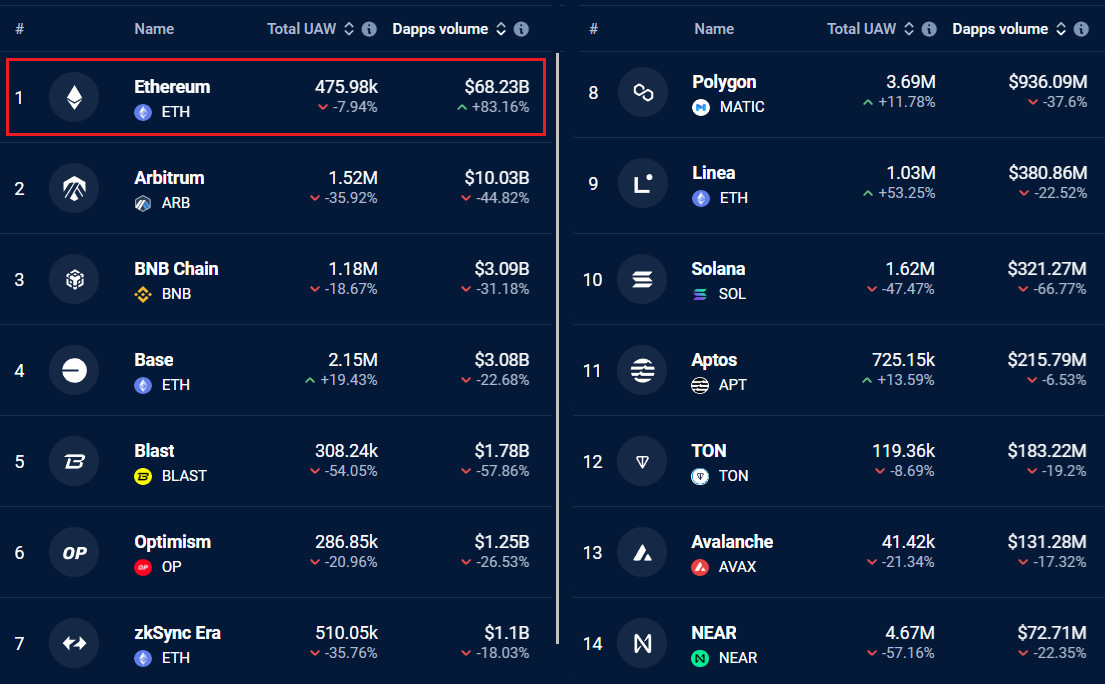
Source: DappRadar
The anticipation surrounding Ethereum ETFs has sparked investor enthusiasm, with expectations of a timely approval.
Vitalik Buterin’s initiative for expediting transactions via single-slot finality aims to enhance network efficiency, adding a ray of hope. Yet, uncertainties in U.S. regulations, combined with Bitcoin’s sell-off, have placed downward pressure on ETH, causing it to dip below key support levels.
ETH Price Analysis
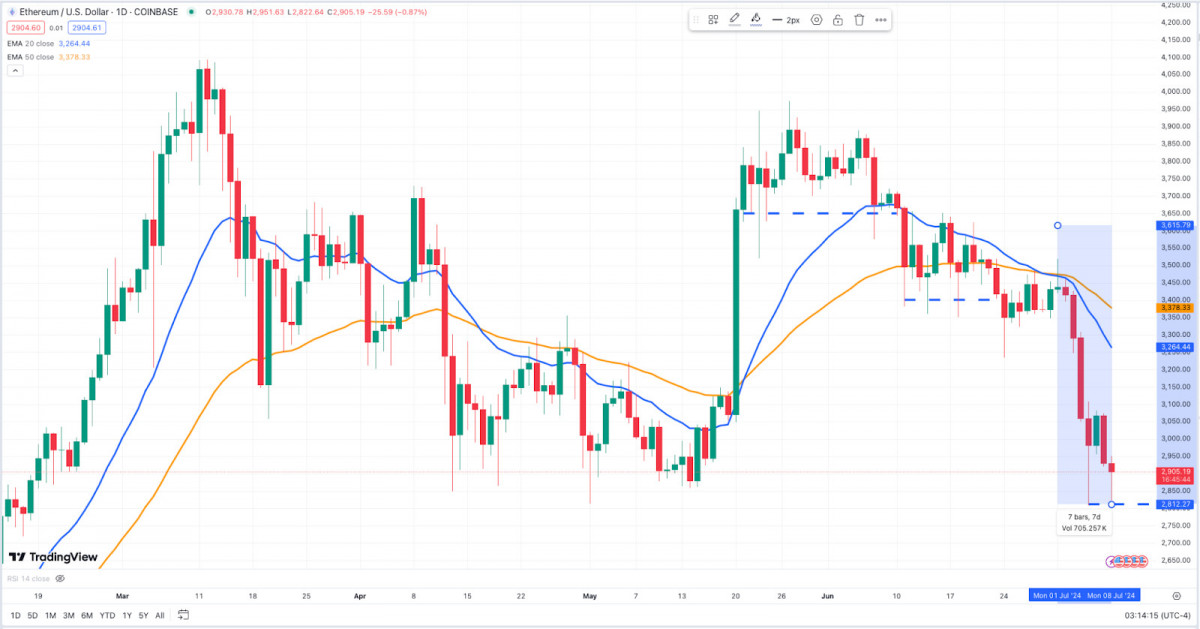
The price dynamics for ETH this past week began with a significant downturn, crashing through the $3,400 support and plunging straight toward $2,800. As anticipated, this decline reflected Bitcoin’s earlier drop.
Source: TradingView
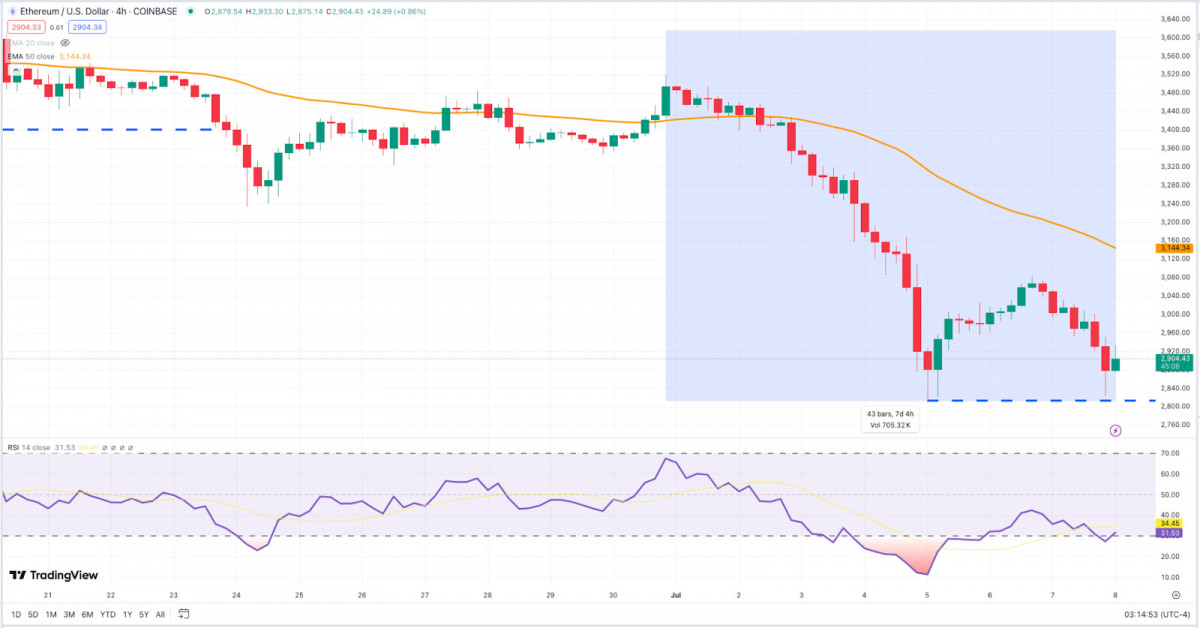
The initial wave of selling was fierce, causing ETH to dip just above $2,800, where it found a temporary base. This level transformed into a crucial battleground, sparking a brief revival as buyers sought to regain stability. Nevertheless, like Bitcoin, this recovery was stymied around $3,160, coinciding with the 50-EMA on the 4-hour chart. This region acted as a formidable obstacle, transitioning the recovery phase into a period of consolidation instead of a robust comeback.
Source: TradingView
On the daily chart, ETH consistently made lower highs and lower lows, a hallmark of a bearish trajectory. The EMAs further support this narrative, with the 20-EMA crossing beneath the 50-EMA, implying persistent bearish momentum.
The $3,400 mark, which previously served as vital support, has now morphed into a resistance level, intensifying the bearish pressure. The inability to reclaim this level during daily closes further contributes to selling momentum.
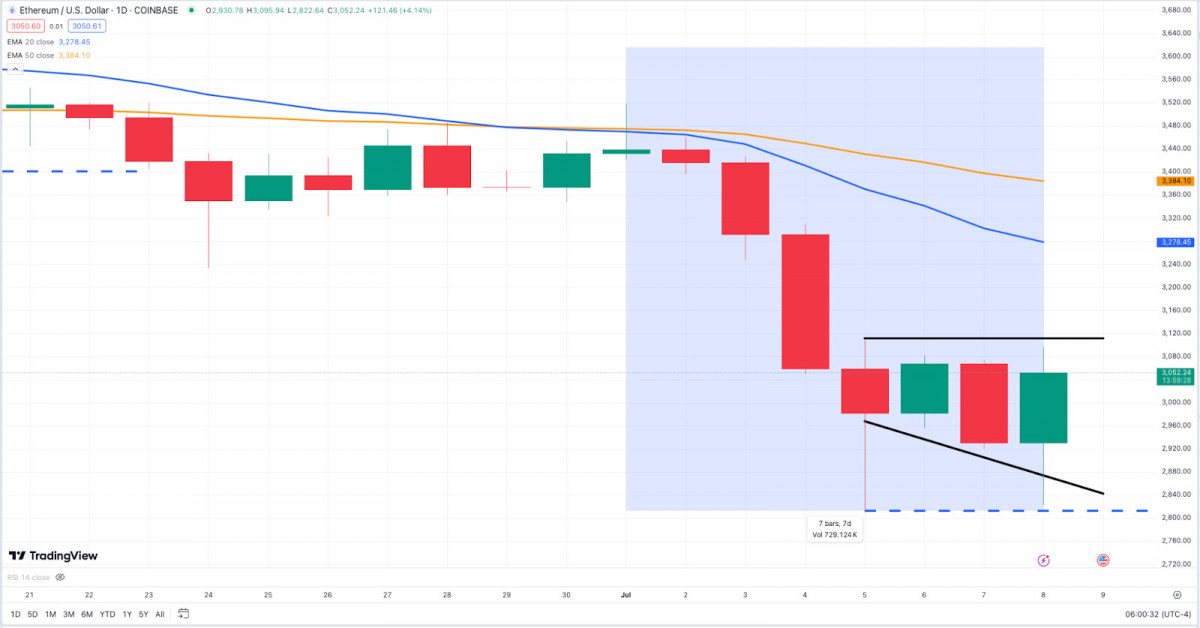
Source: TradingView
In terms of pattern development, the daily chart illustrates a descending triangle, featuring horizontal support at $2,800 amid a series of declining highs. Such formations typically precede additional bearish movements unless there is a meaningful breakout above the upper trendline.
Going forward, the $2,800 support level is critical. A significant breakdown below this could potentially lead ETH to test lower thresholds like $2,600. Conversely, reclaiming the $3,160 mark would signal bullish sentiment, with $3,400 emerging as the next significant barrier.
Toncoin News & Macro
Recently, Toncoin (TON) has gained considerable traction, altering its market perception and price trajectory. The integration of Cobo with the TON blockchain has bolstered digital asset security, enticing institutional clients and triggering even more interest in TON.
In tandem, Notcoin and Helika Gaming unveiled a $50 million Telegram Gaming Accelerator, powered by TON. This naturally elevated Toncoin’s status within the gaming arena. Besides, TON has been tracking price movements akin to other major assets. Let's delve deeper into this.
TON Price Analysis
Early in the week, TON experienced a notable sell-off, declining from $7.80 to a low of $6.60, paralleling the negative trends of BTC and ETH. On the 4-hour chart, this dip engaged the vital $6.60 support level, reminiscent of Bitcoin's challenges around $55,000 and Ethereum's struggles near $2,800.
The robust reaction at the $6.60 mark triggered a rebound to $7.40, meeting with the resistance posed by the 50-EMA; however, this led to a phase of consolidation.
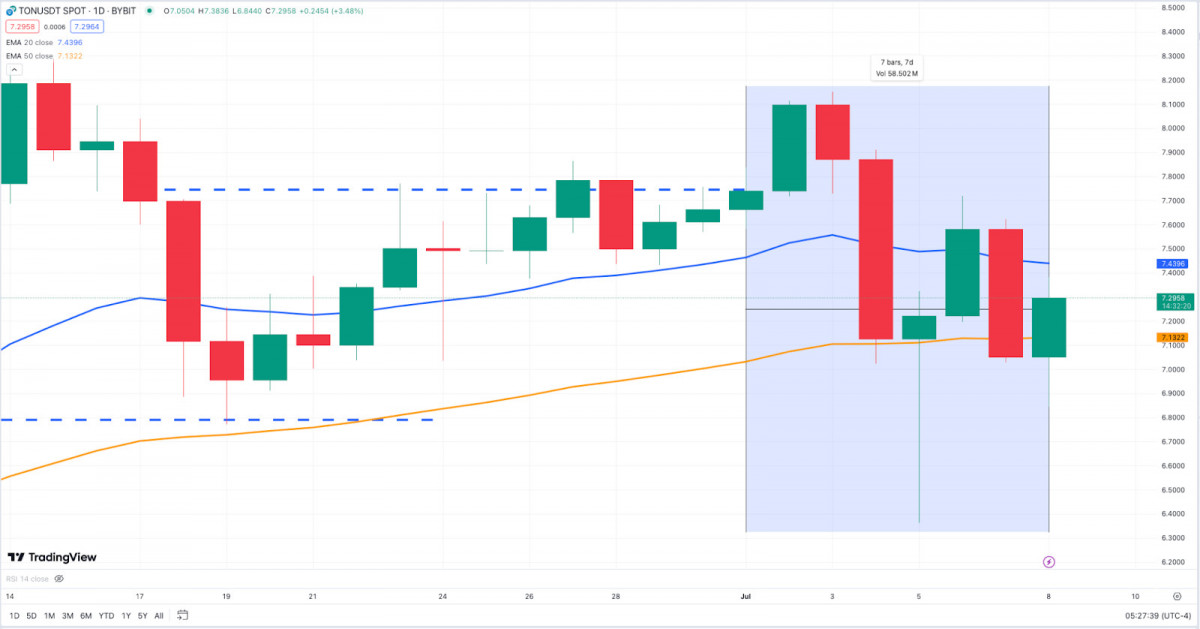
Source: TradingView
Long wicks highlighted the bulls’ attempts to push back, yet ongoing resistance at the 50-EMA kept bears firmly in control.
Source: TradingView
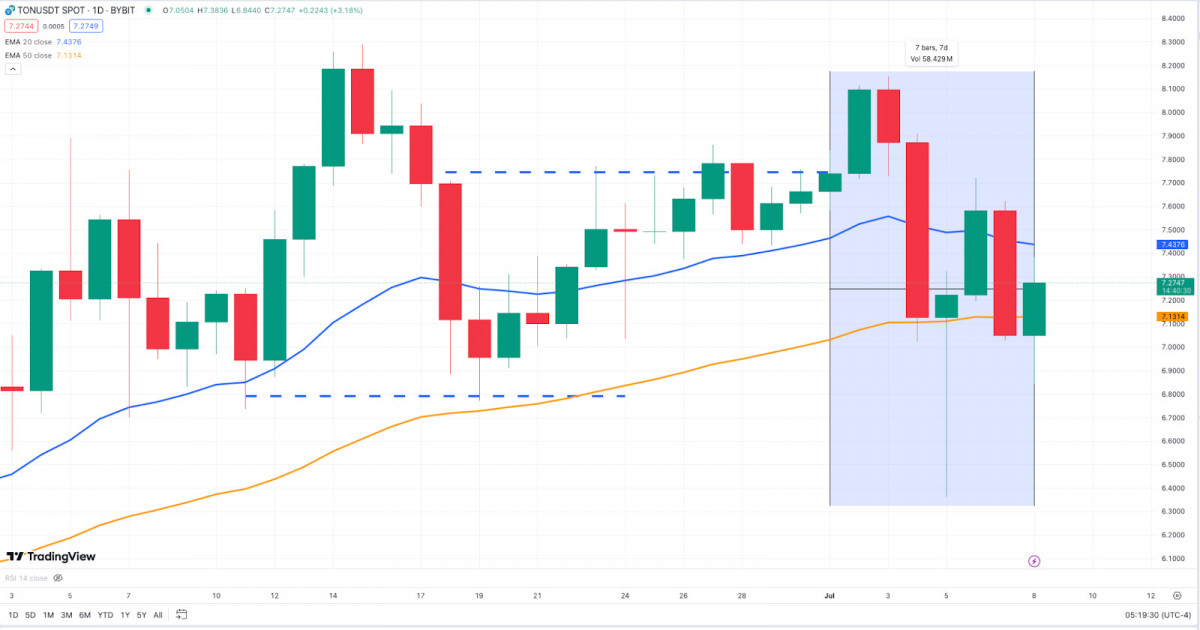
The week began around $7.40 but soon faced selling pressure, with a brief dip below $7.00. Recovery endeavors encountered resistance at $7.40, substantiating a bearish trend. The daily chart indicates a descending channel, hinting at potential for more declines unless TON can breach the upper trendline. Currently, the 20-EMA lies above, but its gradual descent towards the 50-EMA reinforces the bears' grip on power.
In the upcoming days, it’s crucial to monitor the $6.60 support level. A decisive break could open the door for further declines, potentially testing the $6.00 mark. Conversely, reclaiming $7.40 would indicate a bullish resurgence, at least momentarily.
Disclaimer
In line with the Trust Project guidelines Please be aware that the information provided on this page does not constitute legal, tax, investment, financial, or any other type of advice. It’s vital to only invest what you can afford to lose and to seek independent financial consultation if you have any uncertainties. For more detailed information, we recommend reviewing the terms and conditions, along with the help and support sections provided by the issuer or advertiser. MetaversePost is dedicated to providing accurate, unbiased reporting, but market conditions can shift without prior notice.