This Week in Cryptocurrency: Recovery Signs for Bitcoin, Ethereum, and Toncoin After Recent Market Dip
In Brief
Last week, the cryptocurrency scene faced a shock market plunge on August 5, with Bitcoin diving below the $50,000 mark, which triggered panic and led to heavy liquidations. By the week's end, however, Bitcoin, Ethereum, and Toncoin began exhibiting tentative recovery signs, despite the lingering bearish outlook and substantial resistance.

Bitcoin News & Macro
The week started with a severe market crash on August 5 that rattled the entire crypto community. Bitcoin's price fell below $50,000 and triggered a wave of panic that resulted in over $1 billion worth of liquidations. The aggressive sell-off, driven by market makers and firms like Jump Trading, turned what began as a sell-off into a full-blown crash, dragging Bitcoin and other leading cryptocurrencies further down the rabbit hole.

Source: Lookonchain
The significant downturn was exacerbated by increasing recession fears, with analysts foreseeing more challenges ahead.
At one point, the Crypto Fear & Greed Index plummeted to unprecedented low levels, reflecting extreme fear among market participants, and it has struggled to recover since.

The Crypto Fear & Greed Index hit unprecedented lows.
While Bitcoin stumbled, its dominance in the market surged, compelling even more downward pressure on the altcoin scene.
Source: TradingView
As we approach mid-August, major cryptocurrencies remain deeply in the negative territory, suffering double-digit losses compared to the previous week.
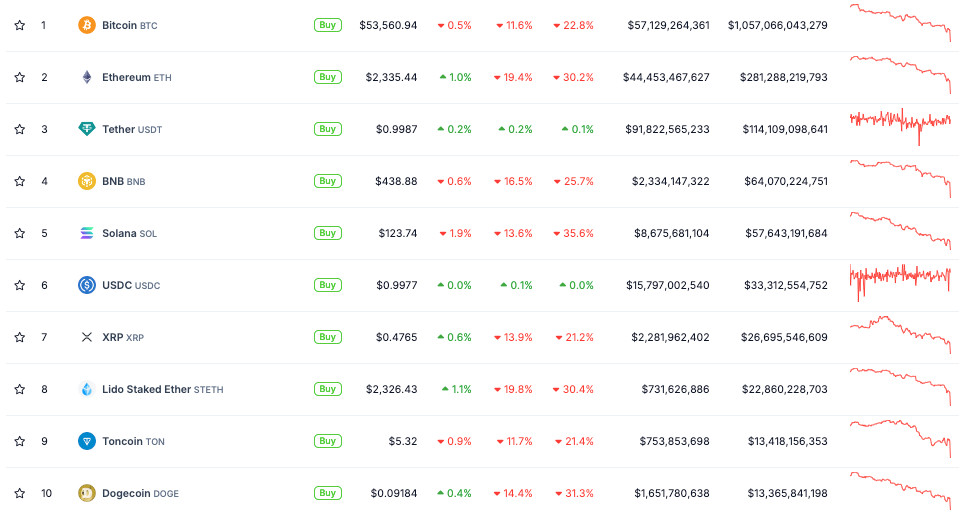
Source: CoinGecko
As the week concluded, Bitcoin hovered near the $60,000 mark, signaling a potential cautious recovery as market sentiment showed signs of improvement. Nevertheless, there's a palpable sense of trepidation among traders and analysts, who remain vigilant of possible economic shifts.
BTC Price Analysis
With that backdrop in mind, let’s examine the technical details from last week’s sudden downturn. It all kicked off with a harsh sell-off that broke through the $62,000 support level, dropping Bitcoin to around $58,000. Panic selling with high volume indicated possible capitulation. Bitcoin managed to find temporary support near $57,000, setting a consolidation pattern that resembled a bearish flag – often signaling impending further decline. But instead of plummeting further, it momentarily rallied above $62,000, which lacked any substantial follow-through, hinting at significant selling pressure.

Source: TradingView
On the daily chart, we saw a death cross as the 20-day EMA dipped beneath the 50-day EMA, heightening the bearish atmosphere. The 4-hour chart reflected this turmoil with a descending triangle pattern, showcasing diminishing bullish momentum as Bitcoin faced repeated tests at the $58,000 threshold. Each rebound was weaker than the last, precluding an inevitable drop that sent the price spiraling down again.

Source: TradingView
Yet, amid this tumult, Bitcoin exhibited some resilience. In the aftermath of the crash, prices began to stabilize, although the crypto remained precariously close to danger. Analysts emphasize that maintaining support above $50,000 is vital to ward off further declines, but a bounce back to $57,000 ignited some optimism. This uptick led traders to speculate that perhaps a market bottom was forming.
Throughout the week, the $57,000 and $62,000 levels emerged as pivotal battlegrounds. It's essential to protect the $57,000 mark to avert a dive into the lower $50,000s. The general market sentiment continues to lean bearish, especially with Bitcoin struggling to gain momentum above these key levels. If $57,000 breaks, a deeper decline seems likely. Conversely, reclaiming $60,000 could spark a rally, though the odds currently seem unfavorable. Traders should closely monitor these levels as they'll be a key determinant of Bitcoin’s forthcoming movements.
Ethereum News & Macro
As anticipated, Ethereum bore the brunt of the market turmoil this week, mirroring the wider chaos affecting all cryptocurrencies. On August 5, Ethereum's price fell below $2,100, closely following Bitcoin's downward trajectory, resulting in a series of liquidations.
In spite of the turbulence, Ethereum began to show signs of stabilization, similar to Bitcoin's recovery attempts. Analysts highlighted the importance of the $2,100 threshold as a critical level – holding above it could prevent further declines. However, the recovery remains shaky, with global economic concerns continuing to amplify volatility.
Further complicating the recovery story were the mixed performances of the newly launched spot Ether ETFs. Even though they attracted some positive inflows, it wasn’t sufficient to bolster trader confidence. Additionally, Ethereum's transaction fees dipped to a five-year low, which illustrated a slowdown in network activity that mirrored the broader market’s challenges.
As the week progressed, Ethereum’s price action remained closely aligned with Bitcoin's, with both cryptocurrencies grappling to regain stability. The market anxiously awaited signals that Ethereum may break away from Bitcoin's gravitational influence, but a cautious atmosphere persisted. All attention focused on the crucial $2,100 mark, widely regarded as a test for Ethereum's endurance.
ETH Price Analysis
Ethereum's price movements during the past week have reflected the instabilities prevalent in the broader market. The crash on August 5 caused ETH to slice through the $3,000 support level effortlessly, dropping down to the $2,100 to $2,200 range during the fearful trading phase, leading to further liquidations.
Source: TradingView
In the daily chart, ETH seemed to find some shaky stability around $2,500, but the consolidation that followed hinted at bearish tendencies. Like Bitcoin, Ethereum managed a brief uptick towards the $2,700 mark, but this rally fell flat, quickly reverting back downwards. The crossover of the 20-day and 50-day EMAs further underscored the escalation of downside risks.
In the 4-hour chart, the narrative mirrored Bitcoin's – while ETH pushed back from oversold conditions, it encountered resistance at the 50-EMA, taking the shape of a descending triangle that signaled dwindling bullish strength. Source: TradingView
Source: TradingView
As we near the middle of August, the $2,500 mark stands as a significant barrier, much like the $57,000 level for Bitcoin. If Ethereum is unable to reclaim the $2,700 mark soon, a substantial retreat toward the low $2,000s could be in the cards. The recent week's failed breakout and continuous selling pressure illustrate that bears remain firmly in command.
Toncoin News & Macro
The recent crash that rattled the market didn't spare Toncoin, yet it managed to uphold its position better than many anticipated. As Bitcoin fell and Ethereum wrestled with pivotal support levels, Toncoin experienced notable developments that influenced its price movements. The integration of sophisticated analytics via IntoTheBlock, featuring over 60 indicators, significantly bolstered the TON ecosystem. This wasn't just a routine tech upgrade; it was a strategic initiative aimed at enhancing user engagement and transparency within the TON network, likely contributing to its stability amid the turbulent market conditions.
Still, Toncoin wasn’t entirely immune to the overarching volatility. Similar to Bitcoin and Ethereum, it encountered challenges in maintaining upward momentum. Toncoin's inclusion on Binance provided a much-needed boost, though a prevailing bearish sentiment kept excessive optimism in check.
As the week drew to a close, Toncoin showed tentative signs of recovery, mirroring the cautious rebounds of its larger counterparts. However, Toncoin's future trajectory will depend on its ability to surpass significant resistance points.
TON Price Analysis
The crash from last week forced TON to break through the $6.80 support level, sending it down to $5.20 with considerable force, paralleling the volatility seen in Bitcoin and Ethereum. A swift rebound occurred, but the cautiously optimistic surge toward $6.80 quickly lost steam due to resistance.

Source: TradingView
On the daily chart, TON briefly recaptured the $6.80 level before slipping back beneath this vital threshold. The hovering 20-day and 50-day EMAs reinforce a bearish outlook, signaling a market where any rally may be swiftly sold off. The 4-hour chart illustrates a similar struggle – TON’s recovery was fleeting, establishing a double top around the $6.80 mark, which indicates strong resistance ahead. The RSI's bearish divergence further implies that bullish momentum is waning.

Source: TradingView
At present, TON is resting around the $6.20 mark, with support at $5.50 back in play. Just like Bitcoin and Ethereum, the next moves for Toncoin will depend heavily on these key levels. If $6.20 fails to hold, revisiting the $5.50 support level seems probable. On the flip side, if TON can reclaim $6.80 with strong conviction, a more significant rally may be on the horizon. But for now, the bearish sentiment is prevalent.
Disclaimer
In line with the Trust Project guidelines Please be advised that the information shared on this page is meant solely for informational purposes and should not be construed as legal, tax, investment, financial, or any other type of advice. It's crucial to only invest what you can afford to lose and to seek independent financial guidance if you have any uncertainties. For additional information, we recommend consulting the terms and conditions as well as the help and support pages provided by the issuer or advertiser. MetaversePost is dedicated to presenting accurate, unbiased reporting, but market conditions may change without prior notice.