Candlestick
What is Candlestick?
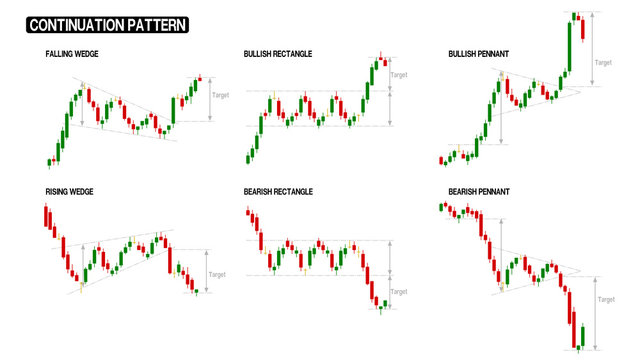
A candlestick chart is more than just a simple graph; it visually summarizes market activity over a defined period. Each candlestick outlines the opening, lowest, highest, and closing values of a market, enabling traders to analyze patterns that can aid in predicting future market movements through technical analysis.
Understanding Candlestick
Traders can customize candlestick charts to suit various time frames, adapting them to their specific needs. These intervals can range dramatically, spanning from a quick one-minute candlestick update to a more extended one-month overview. Typically, short-term traders lean towards lower time frame candlesticks when searching for entry points.
Read related articles:
« Back to Glossary IndexDisclaimer
In line with the Trust Project guidelines Please remember that the information shared on this page is not meant to be misconstrued as legal, tax or financial advice. It's crucial only to invest what you can afford to lose, and if you have any uncertainties, consider seeking advice from a qualified financial advisor. We recommend reviewing the terms and conditions, along with the support resources provided by the issuer or advertiser. MetaversePost strives for accuracy and impartial reporting, but keep in mind that market situations can change rapidly and without prior notice.