Understanding the Bitcoin Plunge: August's Crypto Crisis Unpacked
In Brief

Bitcoin News & Macro
One word sums it up: chaos. And the worst part? It took everyone by surprise… or did it? Let’s break it down.
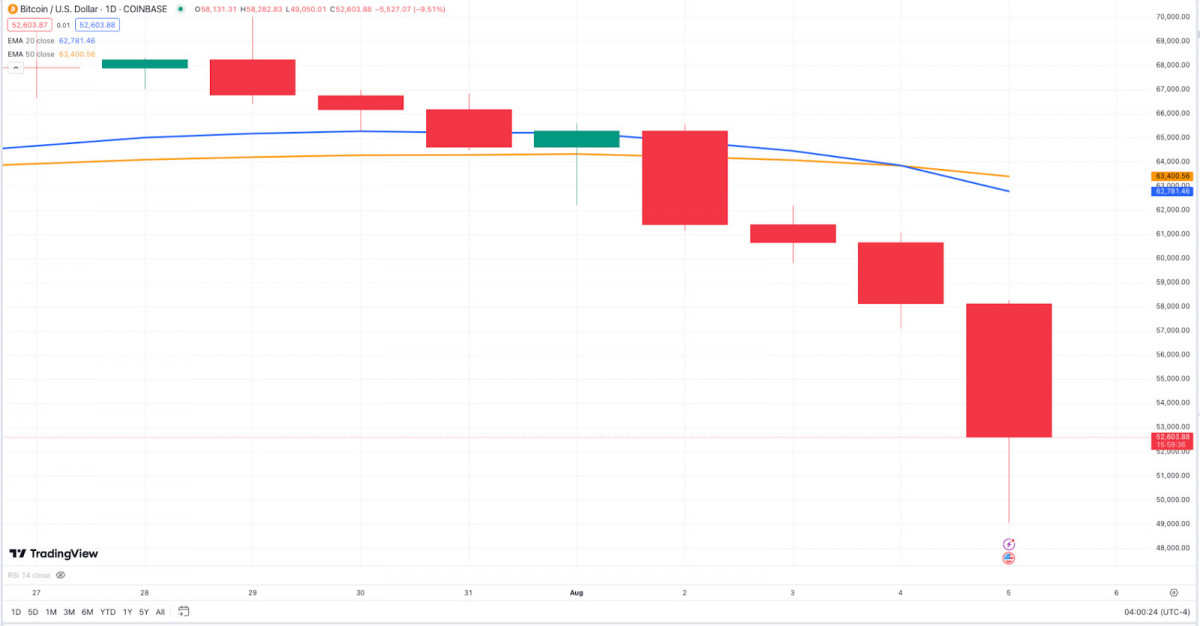
Source: TradingView
As the new week began with a positive outlook, Bitcoin approached the $70,000 milestone, supported by good sentiments and an influx of investments in Ethereum-based ETFs. There was chatter about a possible 'macro summer' rally that fueled hopes of reaching unprecedented highs by 2025. However, as the week progressed, the optimism plummeted.
As July came to a close, the atmosphere turned increasingly tense. Speculations about Bitcoin nearing a crucial 'inflection point' circulated, inspired by a rise in open interest and anticipated regulatory announcements. With new ETF initiatives on the horizon and discussions about a Bitcoin Strategic Reserve Bill in the Senate, the market was finding it hard to breathe under a mix of cautious hope and global economic anxiety.
August 2 struck like a wake-up call. Bitcoin plummeted, dropping below essential support levels and falling from nearly $70,000 to around $65,000. This was triggered by a wave of liquidated leveraged long positions, wiping out more than $600 million in value. The market reacted with alarm, stoking fears of a possible even deeper dive. As it turned out, those fears were not misplaced.
As the days unfolded, Bitcoin's decline intensified, reaching a low of approximately $53,000. Mark this in history—this was the largest three-day decline the crypto sector had seen in a year, with an astounding $500 billion wiped off the total market cap. The market turmoil seemed to stem from a dangerously mixed bag of excessive leverage, economic apprehension, and persistent regulatory gray areas.
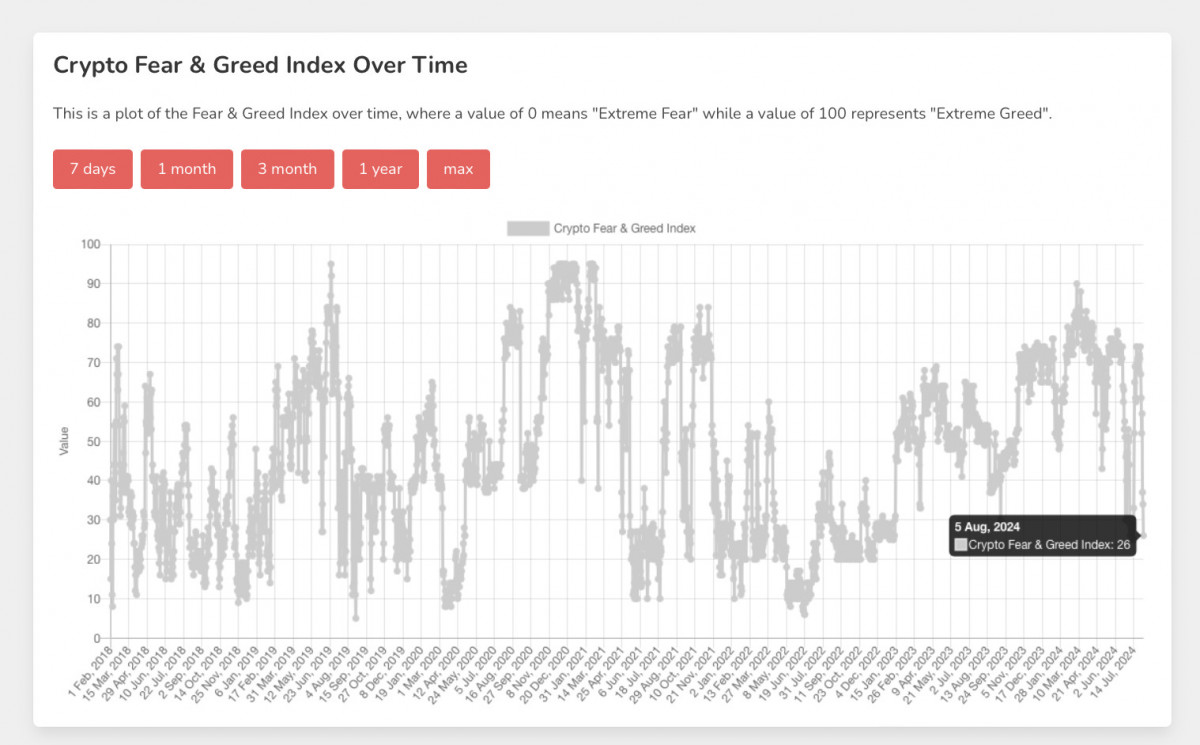
The Fear & Greed Index indicates extreme fear among investors, hitting around the lowest points ever recorded. So, it seems like more volatility is on the horizon.

Source: Alternative.me
As we speak, the market is painted red, and currently, there isn't a glimmer of recovery in sight. While Bitcoin's dominance is increasing, altcoins and stocks are suffering, leaving traders to speculate whether we have reached the market bottom or if further declines await us.
Source: Alternative.me
Now, let's zoom in on Bitcoin's recent price movements (highlighted in blue on the charts). We’ll start with the daily (1D) chart.
BTC Price Analysis
At the start of the week, Bitcoin made a valiant attempt to breach the $70,000 mark, which had been a formidable resistance level in the past. Although the initial surge seemed promising, it quickly devolved into a classic false breakout. The swift rejection led to a series of price drops that breached key support.
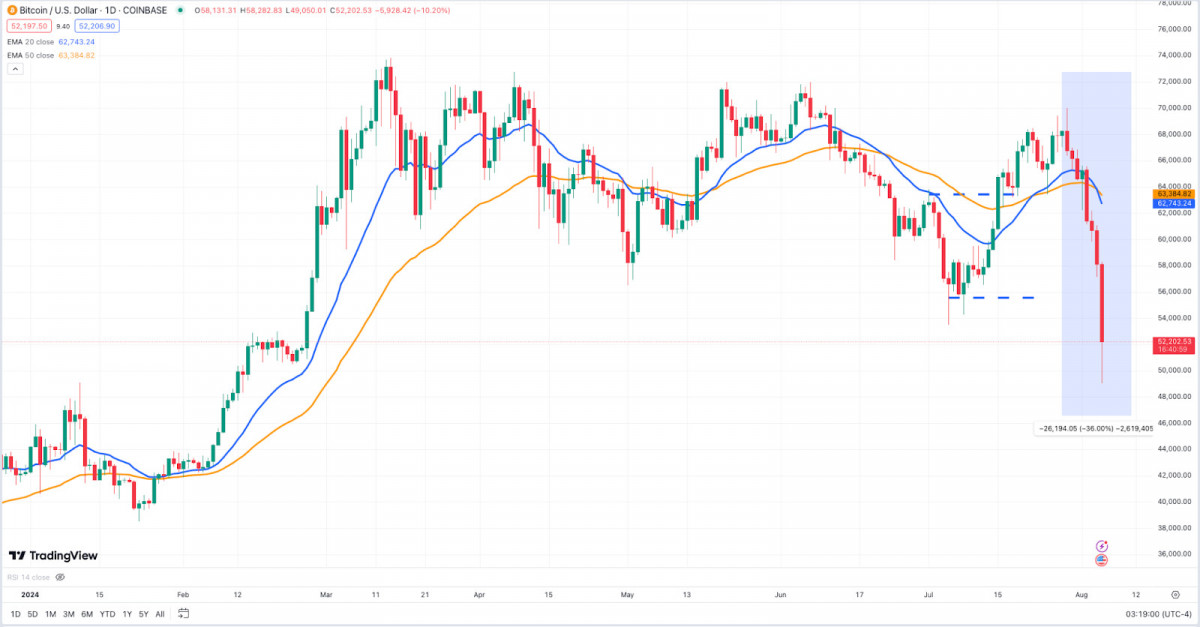
Source: TradingView
The $65,000 support level, which had been a reliable barrier, crumbled under heavy selling pressure. The daily EMAs tell a grim tale as well—the 20-day EMA dipped below the 50-day EMA, indicating a bearish outlook. This so-called 'death cross' propelled the decline, highlighting the overwhelming strength of sellers in the market. The sell-off didn't merely halt at $60,000, another significant support position; it broke through decisively, with heavy trading volumes reflecting fear and imposed liquidations.
Taking a closer look with the 4-hour (4H) chart reveals an even steeper decline, characterized by a lack of consolidation. A brief head-and-shoulders pattern emerged, with the neckline resting around the $65,000 support. Once that support failed, the subsequent drop was relentless. Although the RSI flirted with overbought conditions, the negative momentum proved to be overpowering. At present, we are entrenched in some of the most significant oversold zones we have seen to date. Critical levels, such as the $53,000, which had previously offered strong support during earlier dips, were quickly obliterated.
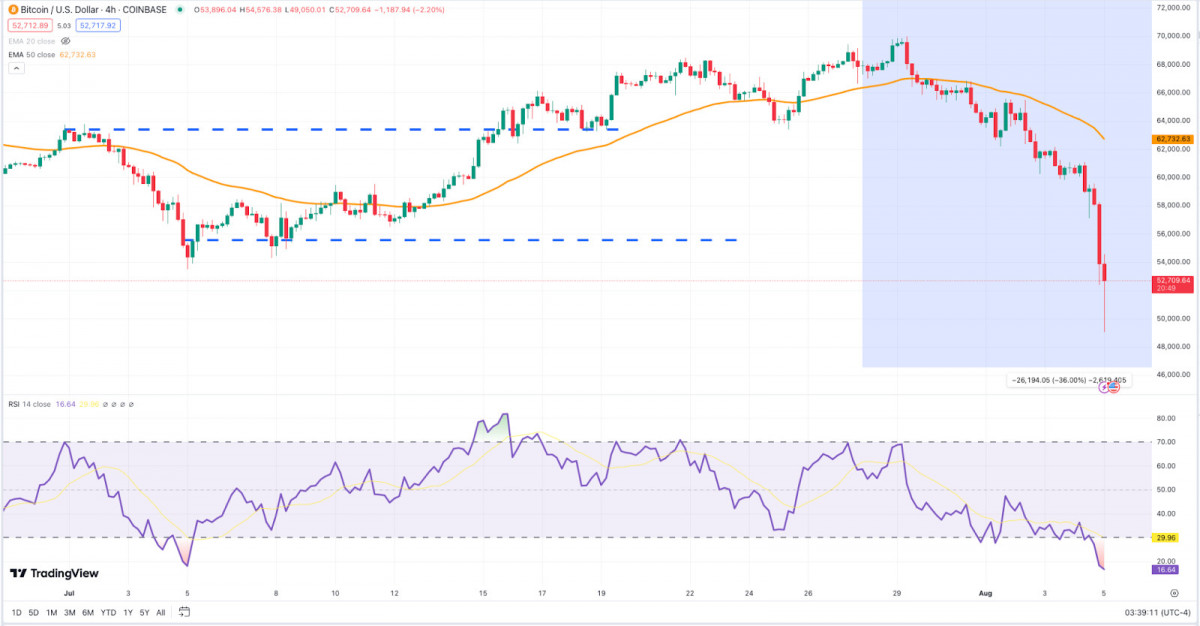
Source: TradingView
The trend based on the weekly opening price was telling. Following a weak attempt to regain higher prices, the price closed considerably lower, setting a bearish tone for the week ahead. Daily closes kept marking lower lows, intensifying the downtrend.
The $50,000 area has now become a crucial battleground. If Bitcoin manages to hold this level, it may halt further declines, but if it breaks through, we could see prices tumble to the range of $44,000 to $42,000. Conversely, should this $50,000 barrier remain intact, we might witness a short-term rebound, although any upwards momentum is likely to encounter formidable resistance.
No doubt, Bitcoin's crash has seized the spotlight in the market, and Ethereum felt every tremor of its big sibling's downturn. Despite a glimmer of hope with Ethereum ETFs launching, the excitement soon waned. Grayscale's Ethereum Trust reported notable outflows, indicating waning investor confidence.
Ethereum News & Macro
Even with some promising developments, like Celestia making strides in data storage solutions, Ethereum couldn't shake off Bitcoin's gravitational influence. The entire crypto community remained hyper-focused on Bitcoin, leaving ETH and other altcoins struggling for attention.
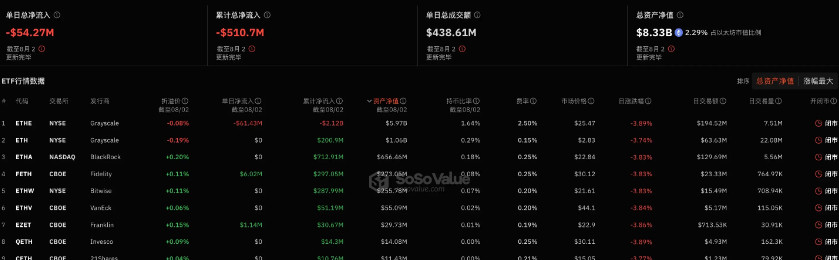
Source: SoSoValue
Compounding the market's woes were disquieting news – such as the massive $266 million hack affecting WazirX and ongoing questions regarding regulatory measures. These factors, along with a lukewarm reception for Ethereum ETFs, left ETH particularly vulnerable.
From a technical viewpoint, Ethereum made a desperate attempt to maintain the $2,860 support level. However, as Bitcoin faltered, Ethereum followed suit, with selling pressures driving the price further down.
This recent plunge isn’t just numbers on a graph; it serves as a harsh reminder of Ethereum's reliance on Bitcoin's movements. The narrative of 'Ethereum trailing Bitcoin' has never been clearer, and the recent drop has left a wave of unease among investors, clouding ETH's short-term prospects.
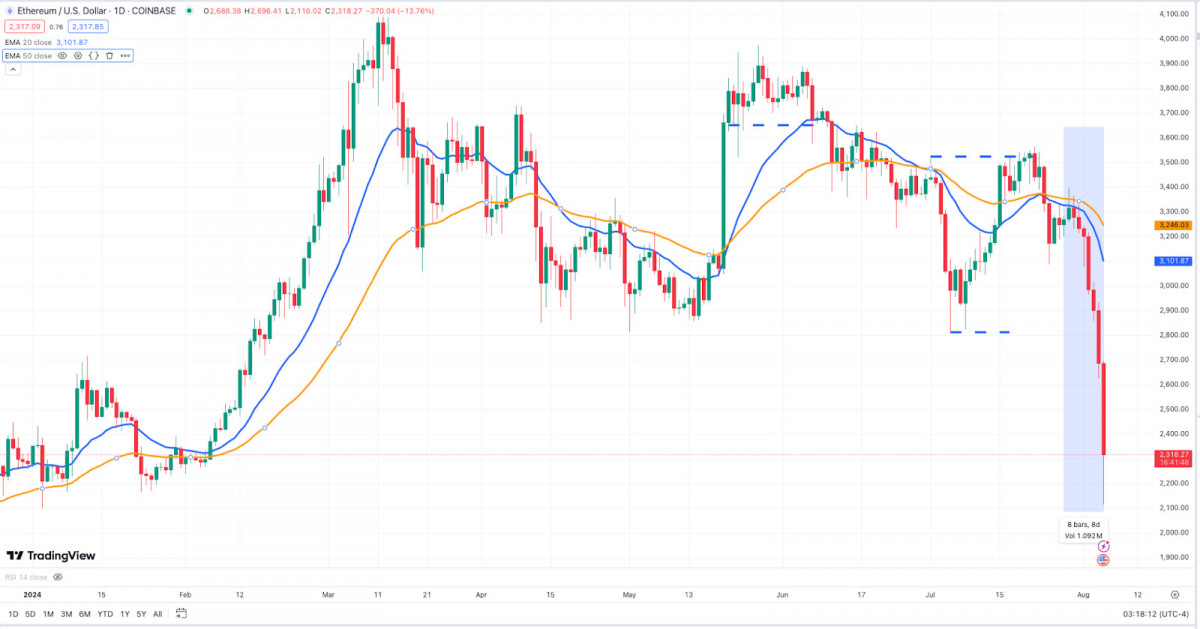
Looking at Ethereum's daily chart, the blue box highlights a stark drop that mirrors Bitcoin's decline. Initially, ETH was hovering around the $3,000 mark, with $3,250 acting as a prior support-turned-resistance threshold.
ETH Price Analysis
As Bitcoin started its descent, Ethereum couldn't maintain its footing and fell past the critical $2,860 level—a significant psychological and technical barrier. The slide below the 20-day EMA, crossing under the 50-day EMA, only further confirmed the prevailing negative sentiment. We observed a series of red candles, indicating not just a decline, but a complete capitulation, exacerbated by Bitcoin's more severe losses.
Source: TradingView
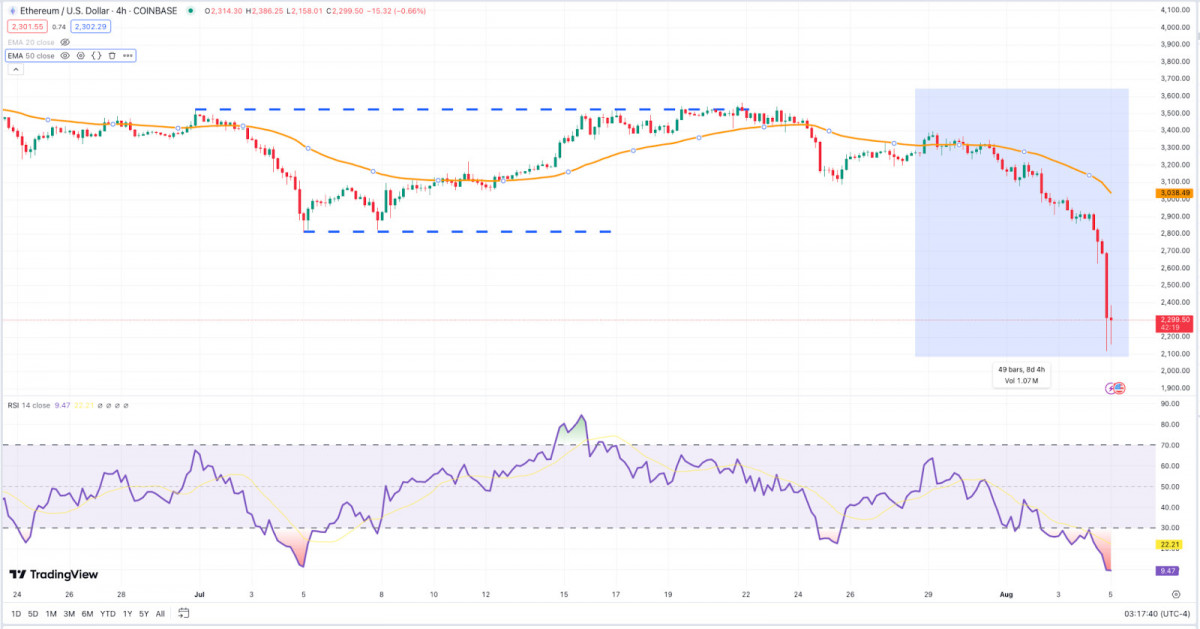
When we dive into the 4-hour chart, the situation appears even grimmer. Ethereum was oscillating between $3,250 and $2,860 until it encountered a formidable bearish engulfing pattern that broke through the lower support. And indeed, the engulfing happened, triggering ETH to fall toward the depths of previous yearly lows.
Source: TradingView
At this point, ETH’s valuation sits around $2,350—a staggering 30% drop since the last Monday, without a single occurrence of a higher high or higher low throughout that period.
When comparing Ethereum's downturn to Bitcoin's, a noteworthy difference emerges. Bitcoin experienced a rapid and steep fall, shaking the market to its core. In contrast, Ethereum appeared to waver, succumbing to a lengthy consolidation phase before breaking down. This suggests that even prior to the dip, Ethereum had its own set of underlying issues—likely a lack of trader confidence. Thus, it's likely that investors will rethink their Ethereum holdings over the coming days.
The pivotal $2,400 mark has now become a defining threshold. Should this level falter, we might see a drop toward $2,000. Climbing back over the $2,500 to $2,800 range could indicate a potential turnaround, but let’s be real—things look pretty heavy right now.
On the other hand, Toncoin has had a relatively quiet week. Not much has transpired aside from a couple of integrations and partnerships here and there.
Toncoin News & Macro
A major highlight was when CurioDAO announced its integration, allowing TON users access to real-world asset (RWA) markets. This significant development could enhance Toncoin's utility, bridging the gap between digital assets and tangible assets.
Further boosting the narrative, Trust Wallet announced a collaboration with The Open Network (TON), aiming to improve GameFi and DApp integration through Telegram's extensive user base. This partnership is expected to simplify TON transactions and broaden its used cases, further amplifying its potential for value appreciation.
Nevertheless, despite these promising advancements, Toncoin couldn't escape the overwhelming waves of the broader market turmoil. With that said, let’s shift our focus to the charts.
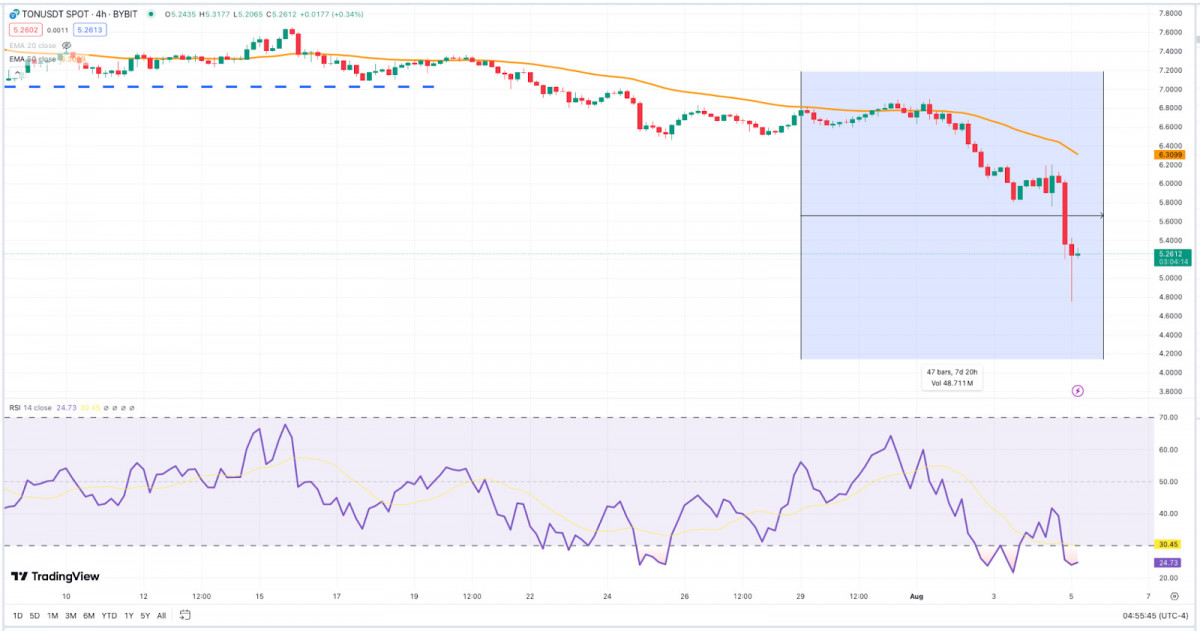
Typically, when Bitcoin drops, it creates a ripple effect that impacts major coins, and TON is no exception to this trend. However, while Bitcoin and Ethereum were in a free-fall, Toncoin took a different route, descending at a steadier pace but ultimately still hitting a significant downturn.
Toncoin Price Analysis
The Downturn of Crypto: Understanding the Significant Bitcoin Decline in August - Metaverse Post
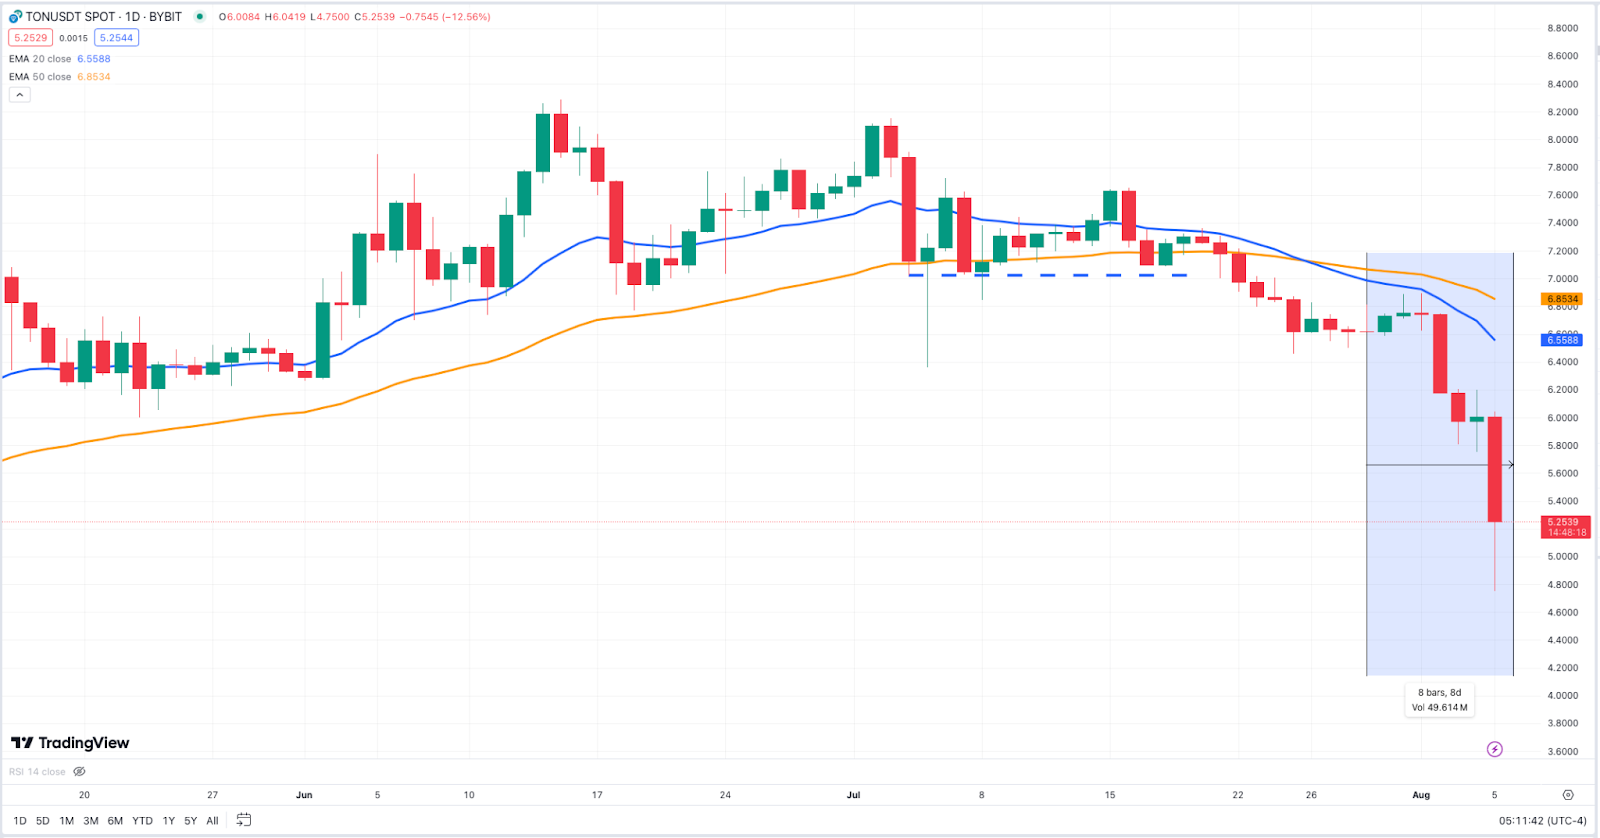
Source: TradingView
This article sheds light on the sudden and drastic drop in Bitcoin's price that occurred in early August. The decline has been linked to factors such as excessive leverage in trading positions, overarching economic concerns, and ongoing regulatory challenges. Other cryptocurrencies, like Ethereum and Toncoin, also experienced declines as the broader cryptocurrency market faced turbulent conditions.
Source: TradingView
The Downturn of Crypto: Understanding the Significant Bitcoin Decline in August
FTC's Attempt to Block Microsoft-Activision Merger Fails
Disclaimer
In line with the Trust Project guidelines Published: August 05, 2024 at 9:51 am Updated: August 05, 2024 at 9:51 am